Step-by-step guide to answering this type of IELTS Writing Task 1 question. Covers structure, key language, and band-scoring criteria.
Originally published June 2017. Last reviewed 3 July 2026.
In this post, I want to share with you the 8 tips that you should remember in order to have IELTS Academic writing task 1 success!
There is a lot of information out there for you to read and remember, but during lessons with my students I always repeat the same things and those that choose to listen and study hard achieve the band score they need (7+!)
So here are the 8 tips for writing task 1 success!
1. Understand the question
Make sure that you read the question properly a few times, so that you fully understand what it is asking you to do. I often read essays where the student has misunderstood the question. This is not good for your score if you do this during your test. So always read the question and make sure that you understand what it is asking you to do.
The questions in writing task 1 normally say ‘report the main features and make any comparisons’. Look for those main features and if you can make any comparisons. You can highlight information on the paper/question before you start to write your essay. Practice as much as possible beforehand, using various academic writing task 1 questions and an approved essay structure.
2. Practice the essay structure
The structure that I advise my students to use, changes slightly depending on which question they have for writing task 1.
However, it has a core structure, that if used well, will be sure to get you a band score 7+. You need to practice using this structure, with as many questions as you can, before sitting your IELTS test. This writing task 1 structure has been proven to be successful for my students and when perfected, can easily help you to achieve a high band score.
3. Create an effective overview
The overview is the most important paragraph in the writing task 1 essay and without one, you will lose marks. this will affect your score and your ability to gain a band score 7 or higher. Practice writing an overview of different types of questions.
4. Use the right language
In the writing task 1 section of this website, you will find language help in most of the posts. It is important to use the right language when writing your essays. This can affect your band score, so it is worth studying and practising as much as possible.
For example, you should be able to paraphrase the question using synonyms, use signposting language (Overall, the line graph shows that..) and linking words(however, in contrast, one the one hand, on the other hand, therefore, in addition, etc). You should also be able to describe change and for the maps questions describe locations this will gain you marks in the lexical resource part of the marking criteria.
5. Know the Grammar
Think about the grammar you are using, if the question features change over a period of time, then make sure you use the correct tense when writing about those changes. For example, if a figure is projected to increase over a period of ten years up until the year 2022, you use the future tense >> ‘The price of oil will continue to increase up to £50billion dollars by the year 2022’. Practice with these types of question, so that you can use the past, present and future tenses.
When practising you can use ‘Grammarly’ which checks your work as you type, this will help you with spelling, punctuation and grammar errors.
6. Know the content
You need to able to report neutrally on the visual information presented to you. You should not include any opinion on the data, only report the data and trends that you can see.
It is a good idea to spend a minute or two looking at your chart/graph and circling/highlighting any information that is important.
For example, think about the following questions:
What is being measured and how?
Is it in percentages? Millions? Degrees? (for the temperature)
Then think about the timing – is it over the period of one year? Five? or Ten?
Can you make any comparisons?
7. Be selective
The question will ask you to ‘report the main features and make any comparisons’ so look for those main features – any highs/lows etc. Don’t write about every piece of information that you can see. This will lose your essay marks and affect your band score.
You need to practice highlighting the main features/any comparisons that you can see and plan your essay around those. Then practice writing in 20 minutes, you do not want to spend too much time on writing task 1, as writing task 2 has more weight in the marks.
8. Can you read it?
When practising writing your essays, check if you can read you own handwriting afterwards. If you find it difficult to read, then so will everyone else! Make it neat and easy to read, this is important so that the examiner can read your writing clearly. The advice from The British Council does say that candidates are allowed to write entirely in capital letters if they wish. This may make your writing easier to read.
It is also important that you separate the paragraphs, and don’t just have one big block of text. This will lose you marks in the test, therefore you can skip a line on the paper, to show that a new paragraph has been started. In the marking criteria, you do get marks for ‘logically organises information and ideas’ (Band score 7) so it is important to show that you have organised your information into logical paragraphs. Take a look at the essay structure to see how to organise those paragraphs well.
Step-by-step guide to answering this type of IELTS Writing Task 1 question. Covers structure, key language, and band-scoring criteria.
Originally published May 2017. Last reviewed 3 July 2026.
This post will help you to write a successful bar chart essay, there is a model answer for you to compare your work to at the end of the post.
Remember that your essay should have a minimum of 150 words and ideally should be completed in 20 minutes.
THE WRITING TASK 1 ESSAY STRUCTURE:
Writing task 1 Question
Read the question below carefully, what can you see in the information given?
STEP 1 – WRITE THE INTRODUCTION
Write your own introduction of one or two sentences, paraphrasing the question, using synonyms where you can.
STEP 2 – WRITE AN OVERVIEW
Write the overview – start this paragraph with the word ‘Overall...’ and write one or two sentences that describe the main features of the information presented in the bar chart.
STEP 3 – WRITE THE MAIN BODY PARAGRAPHS
Write two main body paragraphs, going into detail and giving specific information about the chart. Remember to include data to support your findings. For example, look for the highs and lows and any major increases or decreases over time.
STEP 4 – CHECK YOUR WORK
When you have completed the essay, check it for any errors, spelling or grammar. Then check to see if you have included linking words that connect the information together, making it easy to read. For example, using the word ‘Overall..’ at the beginning of the overview paragraph. You can also use words like – on the one hand, on the other hand, furthermore, however, in addition, finally etc.
MODEL ANSWER
To view the model answer for this question please click the button below >>
We hope you found this post useful in helping you to study for the IELTS Test. If you have any questions please let us know in the comments below or on the Facebook page.
The best way to keep up to date with posts like this is to like us on Facebook, then follow us on Instagram and Pinterest.
If you need help preparing for the IELTS Test, join the IELTS Achieve Academy and see how we can assist you to achieve your desired band score. We offer an essay correction service, mock exams and online courses.
How to Describe Process Diagrams
Process diagrams show the stages involved in making something, or how a natural or mechanical process works. Unlike other Task 1 questions, process diagrams require you to describe a sequence rather than compare data.
Essential Process Vocabulary
Stage
Language
Beginning
The process begins with…, The first stage involves…, Initially…
Sequence
Following this…, Subsequently…, After that…, The next step is…
Simultaneous
At the same time…, Meanwhile…, Concurrently…
Result
This results in…, This produces…, As a result…
Final stage
Finally…, In the last stage…, The process concludes when…
Structure Guide
Introduction: Paraphrase what the diagram shows (e.g., “The diagram illustrates the process by which cement is manufactured”).
Overview: State how many stages there are and whether the process is linear or cyclical.
Body paragraphs: Describe the stages in order, grouping related steps logically.
Tips for Band 7+
Use the passive voice throughout (e.g., “the materials are heated” not “someone heats the materials”)
Include sequencing connectors to show the order clearly
Count the stages and mention the total in your overview
Do not speculate about reasons — only describe what the diagram shows
Originally published on IELTS Achieve. Last reviewed 3 July 2026.
Step-by-step guide to answering this type of IELTS Writing Task 1 question. Covers structure, key language, and band-scoring criteria.
Originally published May 2017. Last reviewed 3 July 2026.
A question on the IELTS academic writing test that is becoming more common, asks the candidate to write about and describe a process.
You may have a natural or a man made process question. In this post we will look at how to write this type of essay, with structure help, vocabulary and sample answers.
Writing Task 1 – Process Essay Structure >>
Paragraph 1 – Paraphrase the question
When writing your own introduction of one or two sentences paraphrase the question and add detail.
Paragraph 2 – Overview of the main features
You need to be able to give a broad summary of the information. This is best started with – Overall.…… then giving details of the main features you can see. You can write this in one or two sentences, which describe the main features of the information that is presented in the process. Think about the number of stages that are in time order, what is happening at the beginning? What is happening at the end? How many stages are there?
Paragraph 3 – Specific details
Write about the process from the beginning, explaining what is happening throughout each stage.
Paragraph 4 – Specific details
Write about the process through to the end, including time connectors that lead the reader through each step of the process clearly.
TIP >> When describing a process you should write using the passive voice, focussing on the activities not the person who is doing them.
Time Connectors >>
The words below can help you to connect the stages of the process you are writing about.
Writing Task 1 Process Sample Essays >>
Here are two sample essay questions and answers for you to look at. Review the language used, the essay structure, the stages and how it has been written.
Sample Process Essay 1
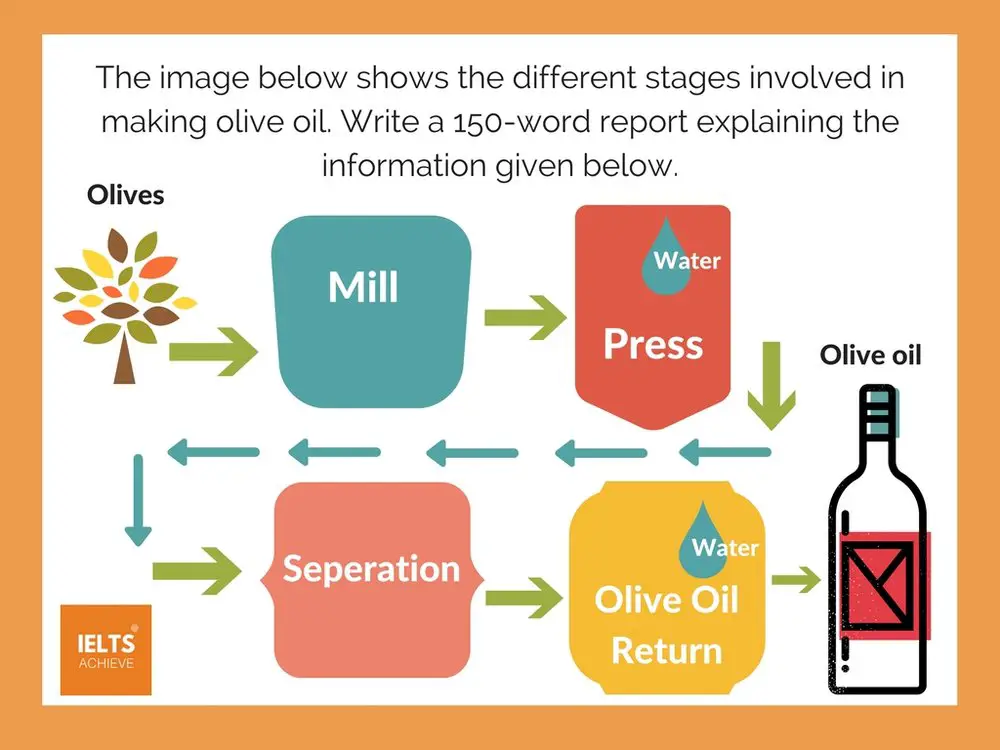
The diagram presents how olive is produced with the use of different equipment.
Overall, olive oil production involves four main stages and needs different equipment to achieve its desired appearance and flavour. The process starts with the breakdown of the olives after collection in a mill and culminates with storing the product in bottles until it is ready for consumption.
The process of making olive oil starts when olives are ground in a mill to create a paste. After the paste has been spread onto mats, this is transferred into a press where water is added. Following this procedure, the mashed olive paste is placed into a separation container where the oil goes through a natural separation process from vegetable waters.
After separation, the mixture goes into the olive oil return, where more water is added and wastewater is subsequently drained. Once this process has ended, the olive oil is ready to be bottled, where it is stored for a period of time known as the clarification stage. Finally, once this time has passed the oil is ready to be used.
(Word Count = 181 / Band Score 9)
Task Achievement – The answer provides relevant information, describing the process of how olive oil is made. The overview gives clear information, leading into the main body paragraphs.
Coherence and Cohesion – The answer has been divided into clear logical paragraphs, with clear cohesion between them with the addition of time connectors (after, following this, finally).
Lexical Resource – There is evidence of paraphrasing, synonyms and some less common words.
Grammatical Range and Accuracy – The answer has no grammatical errors. The sentences are mainly made up of multiple clauses and have a variety of structures. There are no spelling mistakes and punctuation is correct.
TIP >> Write a good overview, with how many stages the process has, starting with and ending with.
TIP >> Describe the process and lead the reader through it by using time connectors.
Sample Process Essay 2
The picture illustrates the process of making paper from the trees that have been collected.
Overall, it can be observed that there are eight stages in this process, beginning with the collection of trees from the forest and ending with the paper being made in the paper making machine.
To begin with, timber is collected from the forest and taken to be debarked. After the wood has been stripped bare, it enters the chipping machine, where it is chopped up into tiny pieces. From the chipping machine, the wood enters into three separate stages. First, the wood chips are put through the mechanical pulping process, where they are ground and smashed into pulp. Then they have a chemical pulping, going next into the hydra-pulper.
In the subsequent stage, the mixture goes through to be screened and cleaned, to filter any lumps or waste from the pulp. Lastly, the pulp is entered into the paper making machine, where it is pressed to make sheets of paper. The paper is then stored and stacked, ready for shipping and to be used.
(Word Count = 179 / Band Score 9)
Task Achievement – The answer provides relevant information, describing the process of how paper is made. The overview gives clear information, leading into the main body paragraphs.
Coherence and Cohesion – The answer has been divided into clear logical paragraphs, with clear cohesion between them with the addition of time connectors (first, then, subsequently).
Lexical Resource – There is evidence of paraphrasing, synonyms and some less common words.
Grammatical Range and Accuracy – The answer has no grammatical errors. The sentences are mainly made up of multiple clauses and have a variety of structures. There are no spelling mistakes and punctuation is correct.
TIP >> Write a good overview, with how many stages the process has, starting with and ending with.
TIP >> Describe the process and lead the reader through it by using time connectors.
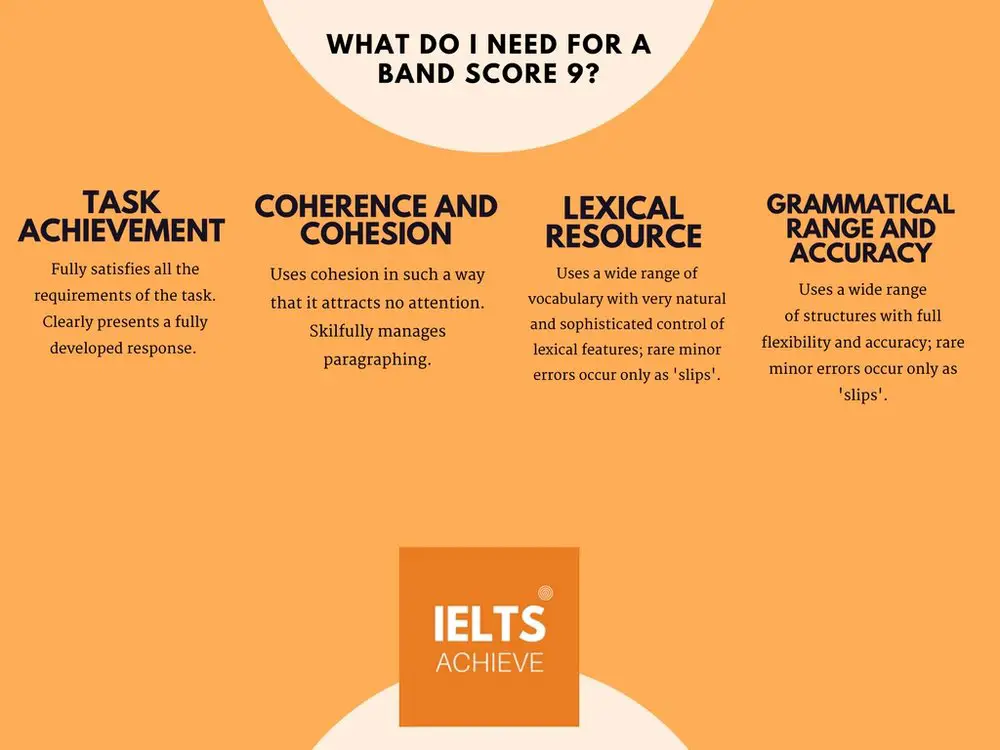
Writing Task 1 Band Score 9 Criteria >>
We hope you found this post helpful in helping you to study for the IELTS Test. Let us know in the comments or on the Facebook page if you have any questions. The best way to keep up to date with posts like this is to like us on Facebook, and then follow us onInstagramand Pinterest. We offer essay correction services, mock exams, and online courses. If you need help preparing for the IELTS Test, join the IELTS Achieve Academy and see how we can help you achieve your desired band score faster.
Step-by-step guide to answering this type of IELTS Writing Task 1 question. Covers structure, key language, and band-scoring criteria.
Originally published May 2017. Last reviewed 3 July 2026.
One of the questions you may have on your IELTS writing task 1 test is a maps question. These are not as common as the charts, but it is worth practising.
In this post, we will look at how to structure your essay for this type of question, how to describe both the general and specific changes, vocabulary and sample answers.
There are a few different types of map question, one will ask you to describe a map in the present, you may be asked to describe two maps, one in the present and one in the future and lastly you may be given a question that asks you describe two maps, one in the past and one in the present.
These questions will require you to show your knowledge of vocabulary and grammar, using the correct tense. You will also use the passive in your writing.
Writing Task 1 – Maps Essay Structure >>
Paragraph 1 – Paraphrase the question
When writing your own introduction of one or two sentences paraphrase the question and add detail.
Paragraph 2 – Overview of the main features
You need to be able to give a broad summary of the information. This is best started with – Overall……. then giving details of the main features you can see. You can write this in one or two sentences, which describe the main features of the information that is presented in the maps. Think about the main changes that you can see have they improved anything? Have they built anything in an area that was the countryside before? Have there been any dramatic changes?
Paragraph 3 – Specific details of the main features
Write about the specific details that you can see – looking closely at the main features and include detail, then make any comparisons if relevant.
Paragraph 4 – Specific details of the main features
Write about the specific details that you can see – looking closely at the main features and include detail, then make any comparisons if relevant.
Describing Changes To A Map >>
Look carefully at the maps you have in front of you (above), have there been a lot of changes? What are the main changes?
The maps are normally labelled for you, with buildings, features and sometimes locations. Below is an example of how to describe changes;
Since 2010, all of the buildings on the Liverpool John Moores University campus have changed. There are quite a few improvements to both buildings and access.
Providing More Detail >>
Describe more differences between the maps, looking at the past and the present. What has stayed the same and what has changed?
The library has been renovated to include IT facilities.
The former chemistry, biology and physics blocks have been demolished and replaced with one large science block.
The car park has been removed and a brand new lecture theatre constructed.
The admin building has been made smaller, to allow better footpath access.
The large car park seen in 2010 has been converted into a bus station.
How To Describe General Changes >>
The words and phrases below can help you to describe the general changes you can see in the maps, for example;
Over the period of 2010 to the present, the area had gradually changed.
The campus changed rapidly, during the six-year period.
During the six-year period, many buildings had been renovated.
Over the last 6 years, there was a large area of redevelopment near the science blocks.
Choose two or three noticeable differences in the map and write a statement for each similar to the examples above, this will become your overview paragraph.
TIP >> Remember that you must report the information you see objectively, you don’t give your opinions or any extra unnecessary information.
How To Describe Locations >>
When describing where things are on the map, it is better to use north, south, east, west, rather than say to the right or to the left. For example;
The library to the north-west of the campus was renovated.
The admin building to the south-east of the campus was relocated.
The small car park to the north-east of the campus was redeveloped into a lecture theatre.
The large car park to the south-west of the campus was constructed into a bus station.
Writing Task 1 Maps Sample Essays >>
Here are two sample essay questions and answers for you to look at. Review the language used, the essay structure, the information gathered and how it has been written. The two essays you see here are from former students who passed their IELTS tests in 2017.
Sample Map Essay 1
The map represents the city of Leeds including two areas, which were suggested as a potential place to build a new shopping mall. The sites are named S1 and S2.
Overall, both of the areas are situated within close proximity of the city centre, although S1 is located in the north of the city centre and S2 is in the south.
On the one hand, area S1 is near to a road, a river and a railway, which form the boundary of the S1 site. Part of a residential area can be found to the north-west of S1’s territory. If the shopping mall is to built on S1, it will be close to this large housing estate, therefore providing easy access to the residents and those who live/work in the city centre. S1 also has easy transport links, being close to both the railway line and the road.
On the other hand, a road on the west side makes up the boundaries of the S2 area and one of the forks in the road forms the northern border. A railway passes through the S2 area and on the right side of this railway there is an industrial estate. S2 is closer to the industrial area than the housing estate. The main road runs through the city and is close to both sites, providing good access. However, a large golf course and park are in the west of the city, which would stop this area from being used as a site.
(Word Count = 250 / Band Score 9)
Task Achievement – The answer provides relevant information, summarising why each site would or would not be ideal for the shopping mall location. The areas are both described in detail, with the relevant information given.
Coherence and Cohesion – The answer has been divided into clear logical paragraphs, with clear cohesion between them with the addition of linking words (overall, on the one hand, on the other hand, therefore).
Lexical Resource – There is evidence of paraphrasing, synonyms and some less common words. They have used words such as transport links, northern border and residential area, that are not included on the map.
Grammatical Range and Accuracy – The answer has no grammatical errors. The sentences are mainly made up of multiple clauses and have a variety of structures. There are no spelling mistakes and punctuation is correct.
TIP >> Remember to compare the areas you are looking at and identify the main changes that you can see. Think about why those things seem important and if there is a common theme. This will help you to gain a high score.
The images show how the planned new improvements will not only change the look but also improve the functionality of Park Avenue.
Overall, the most important change will be the addition of safety measures and the appearance of foliage amid the initial monotonous city design. The sidewalks will be wider on both sides of the road and bicycle lanes will be added, while a pedestrian crossing will also be constructed at the bottom of the street. The crossing will have an island where pedestrians can wait.
The wider sidewalks will ensure that people can enjoy their strolls and joggers will have a place to run without bumping into each other. The bike lanes reduce traffic problems that might arise, when cyclists are caught in traffic or when they try to move fast on the sidewalks. So this change raises the degree of safety and comfort for everyone.
The new pedestrian crossing is making the area safe for the community and is very clear for drivers. This will be safer for people to cross the road, as before there was no safe way of crossing the road. The trees planted, will not only improve the aesthetics of the area but will help to reduce CO2 emissions and offer some welcomed shade during hot summer days.
(Word Count = 213 / Band Score 9)
Task Achievement – The answer provides relevant information, summarising the changes. The suggested changes have been described throughout the essay. They are given a clear breakdown in the overview, with further explanations in the main body paragraphs, not only of the change but of their purpose and function.
Coherence and Cohesion – The answer has been divided into clear logical paragraphs, with the detail of safety measures and how it will affect the environment.
Lexical Resource – There is evidence of paraphrasing, synonyms and some less common words. They have used words that are not included on the map.
Grammatical Range and Accuracy – The answer has no grammatical errors. The sentences are have a variety of structures. There are no spelling mistakes and punctuation is correct. The tenses used are clear when referencing the present and the future.
TIP >> Remember to compare the maps you are looking at and identify the main changes that you can see. Think about why those things seem important and if there is a common theme. This will help you to gain a high score.
Writing Task 1 Band Score 9 Criteria >>
We hope you found this post useful in helping you to study for the IELTS Test. If you have any questions please let us know in the comments below or on the Facebook page.
The best way to keep up to date with posts like this is to like us on Facebook, then follow us on Instagram and Pinterest.
If you need help preparing for the IELTS Test, join the IELTS Achieve Academy and see how we can assist you to achieve your desired band score. We offer an essay correction service, mock exams and online courses.
Step-by-step guide to answering this type of IELTS Writing Task 1 question. Covers structure, key language, and band-scoring criteria.
Originally published May 2017. Last reviewed 3 July 2026.
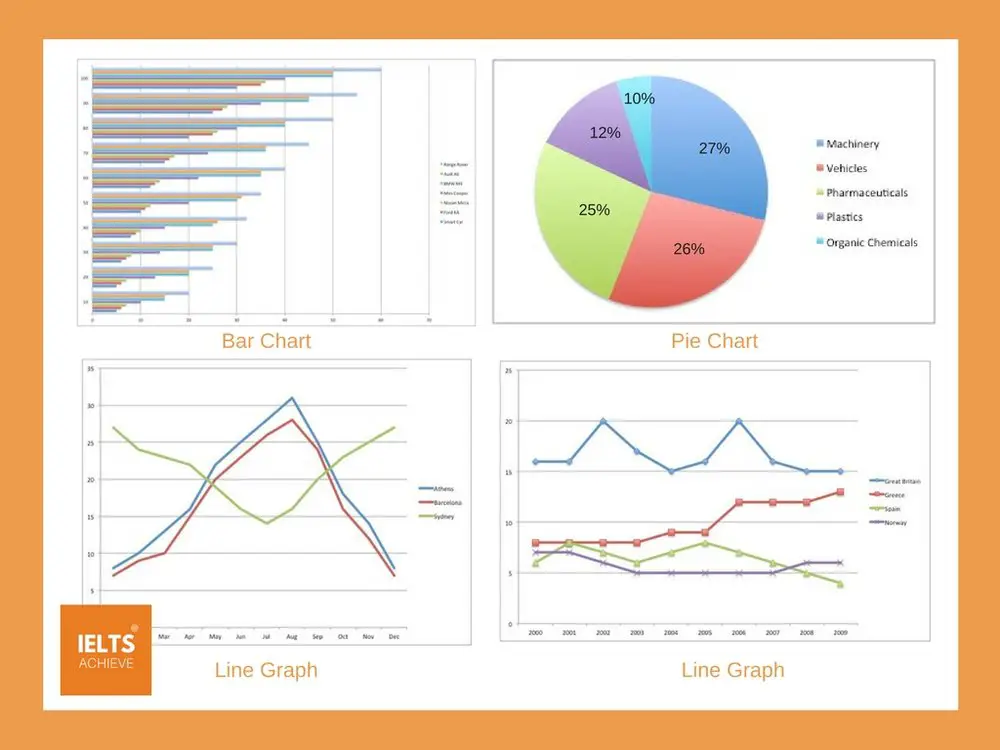
In writing task 1, you may be asked to write about a chart, line graph, table or proportional bar chart.
There is a number of practice questions out there for you to try and perfect your answers in preparation for the Academic IELTS test. In this post, we will be looking at line graphs, bar charts, pie charts, useful vocabulary and describing changes over time.
Here are a few examples below of the graphs or charts you may see >>
You need to able to report neutrally on the visual information presented to you. You should not include any opinion on the data, only report the data and trends that you can see.
It is a good idea to spend a minute or two looking at your chart/graph and circling/highlighting any information that is important.
For example, think about the following questions >>
What is being measured and how?
Is it in percentages? Millions? Degrees? (for the temperature)
Then think about the timing – is it over the period of one year? Five? or Ten?
Can you make any comparisons?
The Essay Structure >>
Paragraph 1 – Paraphrase the question
When writing your own introduction of one or two sentences paraphrase the question and add detail.
Paragraph 2 – Overview of the main features
You need to be able to give a broad summary of the information. This is best started with – Overall……. then giving details of the main features you can see. You can write this in one or two sentences, which describe the main features of the information that is presented in the chart or graph.
Paragraph 3 – Specific details of first main feature
Write about the specific details that you can see – looking closely at the first main feature and including data/stats and trends. Make any comparisons if relevant.
Paragraph 4 – Specific details of second main feature
Write about the specific details that you can see – looking closely at the second main feature and including data/stats and trends. Make any comparisons if relevant.
TIP >> You will be marked on the type of information you write about, as well as the language you use. You need to make sure the information you write down is accurate. If it is not, then your score will be lower.
TIP >> Leave time at the end to check your work – you need to make sure there are minimal errors in the writing (the language) and that you have accurate data.
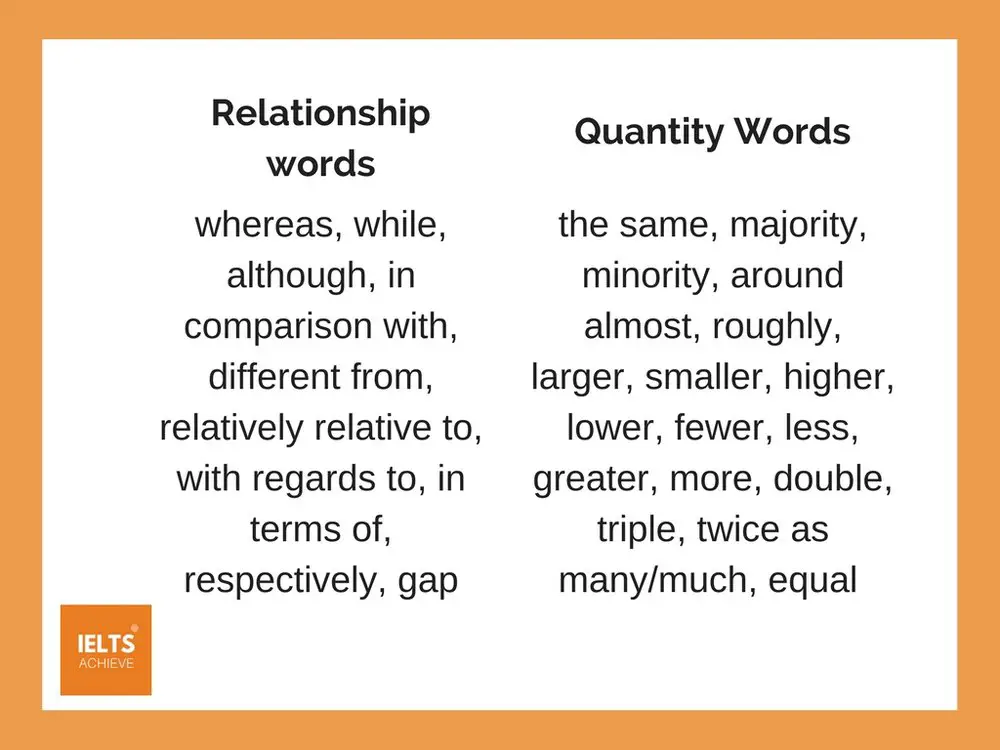
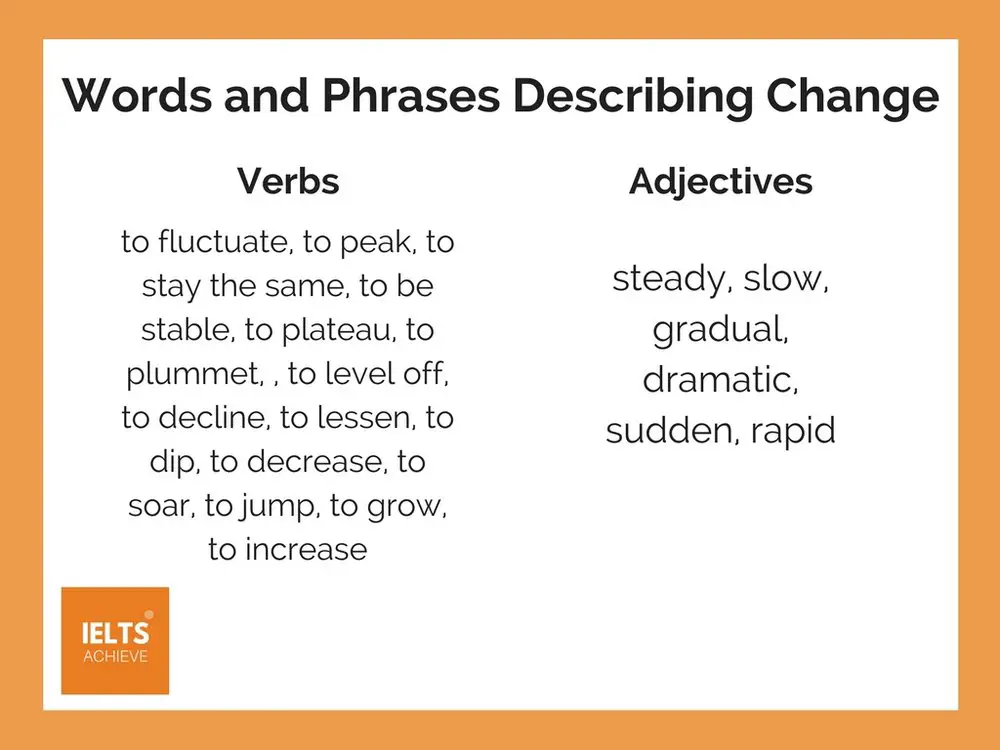
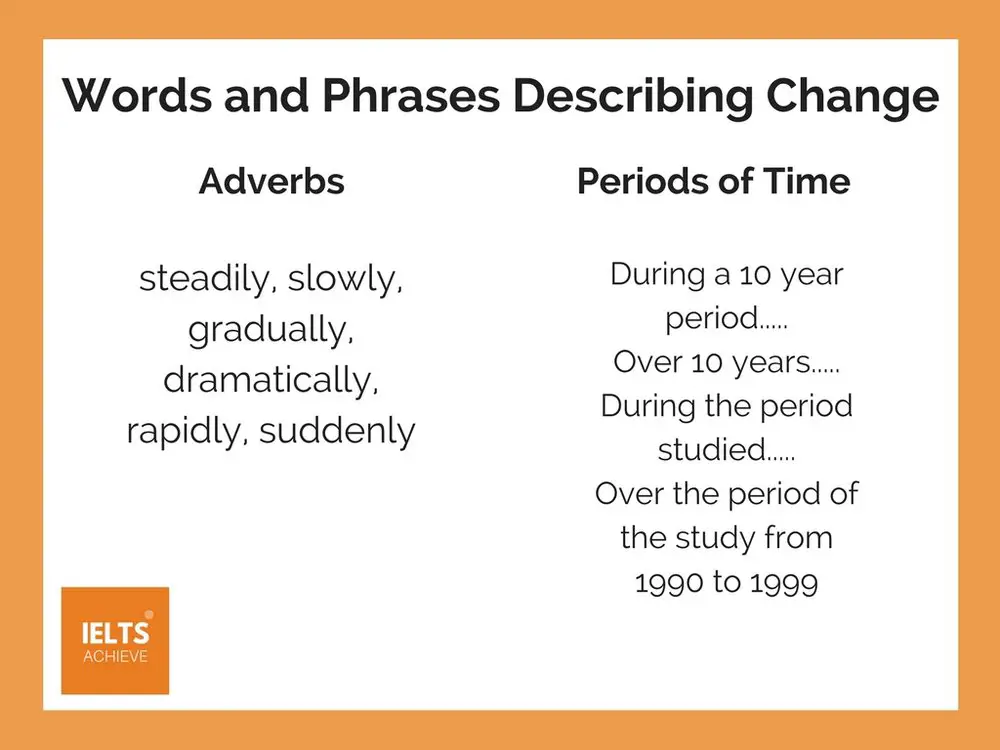
Here are some words and phrases that you can use in task 1 >>
These words and phrases can be used to describe the information in a formal academic way. Here are some examples of how they might be used >>
The number of people who have higher-level qualifications is the same as the number who have no qualifications.
While students read every type of textbook, no students read any magazines.
With regards to medical journals, there is no significant difference between the reading habits of nurses and doctors.
The number of nurses (30) who read medical journals is much smaller than the number of doctors (70).
There is only a slight difference in the number of nurses and doctors who read monthly medical journals.
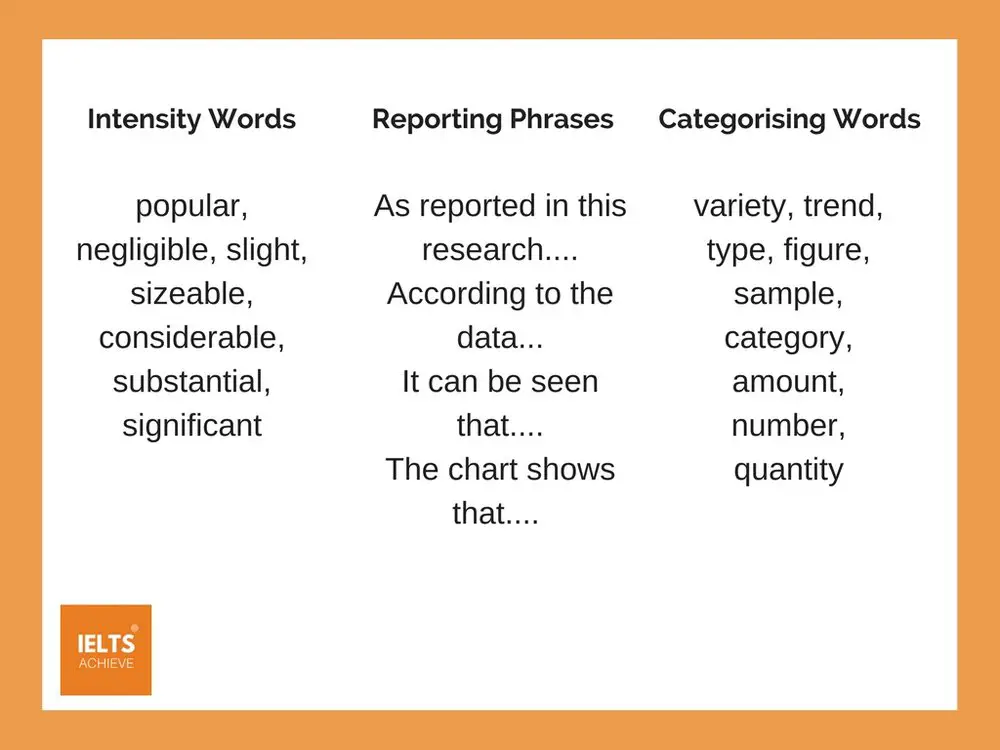
Here is a list of words and phrases that you can use in your essay, to show intensity, reporting phrases and categorising words >>
TIP >> During the exam, students can make notes on the question paper, which is separate from the answer sheet. The examiner does not see these notes. You can circle words or make notes to help you write your essay.
TIP>> Using the word respectively can be useful when writing your task 1 essay. This is a high-level vocabulary word, used to indicate the order in which information is given.
Describing Changes Over Time >>
The list of verbs and adjectives below are useful for describing changes over time, they should be used objectively to describe obvious changes that you can see. For example;
The number of people who read medical journals decreased in 1999.
The number of people who applied to medical school fluctuated from 2005 – 2007.
The number of people who graduated medical school peaked in 2010.
The number of students attending biology class remained steady during the period of 1999, with a sudden decline in 2001.
These adverbs and periods of time can also help you to describe the information you are writing about, for example;
The number of students who attended medical courses in 1999 gradually increased from 20,000 to 60,000.
Over the period of the study from 1990 to 1999 there was suddenly a sharp decline in the number of library books returned by students.
Writing Task 1 Charts and Graphs Sample Essays >>
Here are three sample essay questions and answers for you to look at. Review the language used, the essay structure, the information gathered and how they were written. In all of these questions, the minimum word count is 150 words.
Sample Line Graph Essay
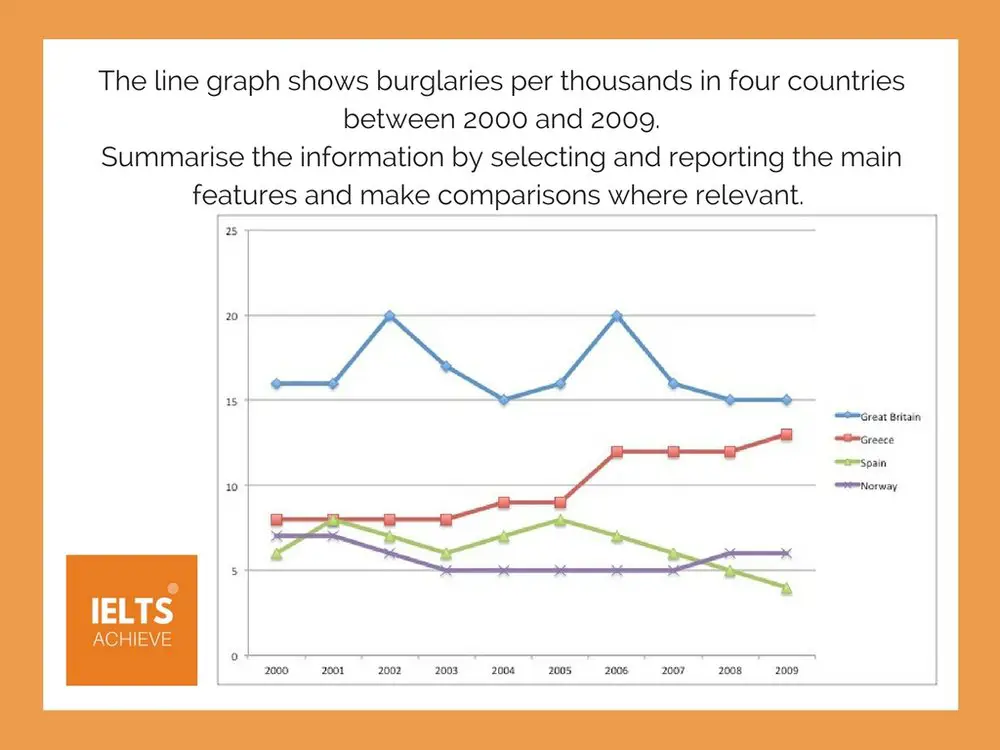
The graph illustrates comparative statistics on the number of burglaries in four countries (Great Britain, Greece, Spain and Norway) over a 10-year period (2000-2009). The units of thefts were measured in thousands.
Overall, the highest recurrence of burglary was in Great Britain, which was fairly high from 2000-2009 in comparison to the other countries, while the lowest incidence when the study began in 2000 was in Spain. It can be seen that in 2009 Spain reported slightly lower figures than the other four countries.
The graph shows that Great Britain’s burglaries were consistently high, never below the 20,000 mark, though the trend fluctuates over the 10-year period. According to the data, the country experienced the highest number of thefts during 2002 (20,000) and 2006 (20,000). However, it experienced its lowest amount stolen in 2009 at approximately 15,000.
Similarly, Spain experienced fluctuating trends, but on the opposite side of the spectrum as it reported the least amount of burglaries in 2000 (6,000) with frequency varying over the years and finally reporting a decline in 2009 (4,000). However, other notable statistics are Greece’s upward trend in the number of burglaries, which started in 2000 (8,000) and finally peaked at 14,000 during 2009. Norway is also noteworthy for having considerably low thefts over the course of 10 years compared to the other countries, dropping sharply in 2003, but increasing slightly from there, finally peaking at 6,000 slightly higher than Spain.
(Word Count = 237 / Band Score 9)
Task Achievement – The answer provides a paraphrased question, to begin with, followed by an overview that gives the reader key information.
Coherence and Cohesion – The answer has been divided into clear logical paragraphs.
Lexical Resource – There is evidence of paraphrasing, synonyms and some less common words (fluctuating, spectrum).
Grammatical Range and Accuracy – The answer has no grammatical errors. The sentences are mainly made up of multiple clauses and have a variety of structures.
TIP >> Remember to identify two or three main features and write about those. You don’t need to write about everything you see in order to gain a high band score.
Sample Bar Chart Essay
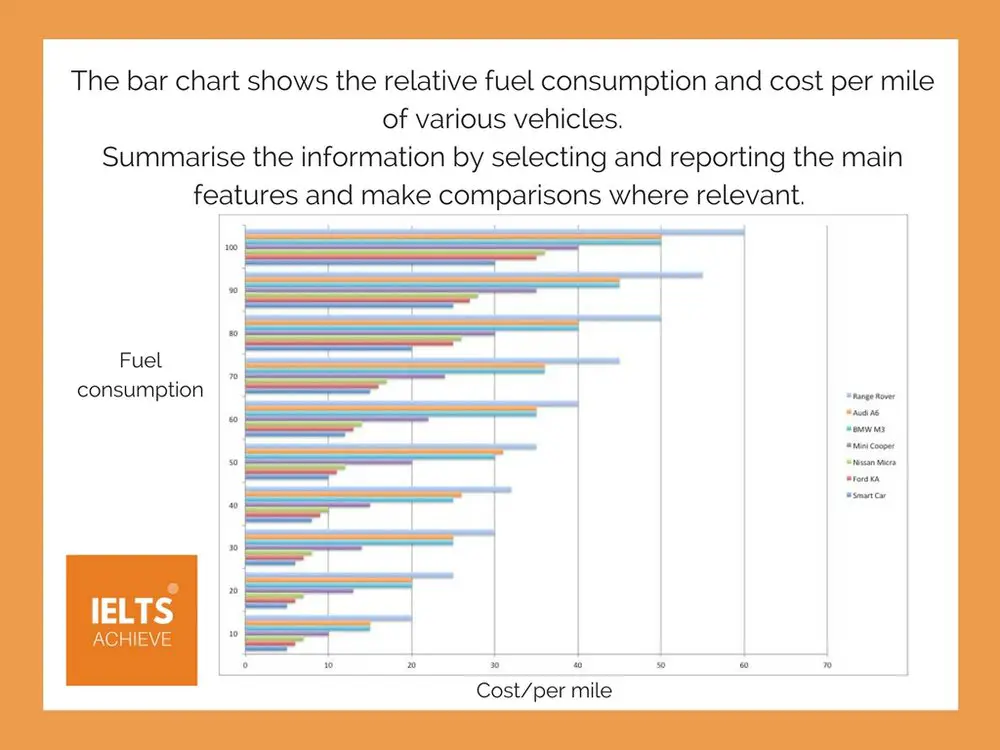
The bar chart displays the estimated fuel consumption and cost per mile of some vehicles. Therefore, this report explains the relevant data of the diagram and the differences among the fuel costs for each type of vehicle.
Overall, there is a significant difference between the Range Rover and Smart Car fuel consumption; the chart also shows that the Smart Car is the lowest fuel consumer of all the vehicles. However, there is a common pattern in the increase of the cost and the miles travelled, from all of the vehicles.
On the one hand, the cars with low fuel consumption include the following; Smart Car (approx. £5/10 miles), Ford KA (approx. £6/10 miles) and the Nissan Micra (approx. £7/10 miles). The Range Rover uses a high level of fuel in comparison to the Smart Car, using three times the amount at £20/10 miles.
On the other hand, the exception to this general trend is the variation of the cost of the Range Rover and Audi A6 from the rest of the vehicles at nearly £20/10 miles and £15/10 miles respectively. In addition, the BMW M3 also uses £15/ 10 miles, while the Mini Cooper consumes at least £5 less for travelling 10 miles at £10.
Finally, this bar chart illustrates an exponential increase in the cost of fuel consumption of all the luxurious vehicles, with an exception for those, which are smaller, more environmentally friendly and essential for everyday use, such as the Smart Car, Ford KA and the Nissan Micra.
(Word Count = 252 Band Score 9)
Task Achievement – The answer provides a paraphrased question, to begin with, followed by an overview that gives the reader key information. This shows a fully developed response.
Coherence and Cohesion – The answer has been divided into clear logical paragraphs. Linking words have been used to skilfully guide the reader through the information given (overall, one the one hand, on the other hand, finally).
Lexical Resource – There is evidence of paraphrasing, synonyms and some less common words.
Grammatical Range and Accuracy – The answer has no grammatical errors. The sentences are mainly made up of multiple clauses and have a variety of structures.
TIP >> Remember to identify two or three main features and write about those. You don’t need to write about everything you see in order to gain a high band score.
TIP >> Look for the highs/lows /increases/decreases and any comparisons you can see. Write about one main idea in each main body paragraph.
Pie Chart Sample Essay
The pie charts illustrate the outcome of the survey conducted to a hundred visitors to Luton airport in order to evaluate their customer service, in 2010 and 2015.
Overall, it can be seen that a lot of people were satisfied by the services offered in 2010, but there was also a large number who thought the services given were poor. However, after 5 years, this trend changed. It shows that many found the services to be both good and excellent, with a decline in the number of people who were unsatisfied.
To begin with, in the year 2010, 45% of the respondents found the airport services satisfactory and exactly 14% rated it as good, while 5% considered the services excellent. Nevertheless, it also shows that the visitors rated it as poor and more so, very poor with 21% and 15%, respectively.
Over the 5-year period, the trend showed an improved airport service in 2015, wherein 39% of the visitors thought that services were good. Moreover, exactly 28% of the respondents answered that they received an excellent service while more than 15% said it was satisfactory. Lastly, we can observe that around 10% rated the services poor and very poor in comparison to the 2010 survey.
(Word Count = 205 Band Score 9)
Task Achievement – The answer provides a paraphrased question, to begin with, followed by an overview that gives the reader key information. The information selected is relevant.
Coherence and Cohesion – The answer has been divided into clear logical paragraphs.
Lexical Resource – There is evidence of paraphrasing, synonyms and some less common words.
Grammatical Range and Accuracy – The answer has no grammatical errors. The sentences are mainly made up of multiple clauses and have a variety of structures.
TIP >> Remember to identify two or three main features and write about those. You don’t need to write about everything you see in order to gain a high band score.
TIP >> When comparing two charts, look for the key trends.
Writing Task 1 Band Score 9 Criteria >>
We hope you found this post useful in helping you to study for the IELTS Test. If you have any questions please let us know in the comments below or on the Facebook page.
The best way to keep up to date with posts like this is to like us on Facebook, then follow us on Instagram and Pinterest.
If you need help preparing for the IELTS Test, join the IELTS Achieve Academy and see how we can assist you to achieve your desired band score. We offer an essay correction service, mock exams and online courses.