Step-by-step guide to answering this type of IELTS Writing Task 1 question. Covers structure, key language, and band-scoring criteria.
Originally published May 2017. Last reviewed 3 July 2026.
This post will help you to write a successful bar chart essay, there is a model answer for you to compare your work to at the end of the post.
Remember that your essay should have a minimum of 150 words and ideally should be completed in 20 minutes.
THE WRITING TASK 1 ESSAY STRUCTURE:
Writing task 1 Question
Read the question below carefully, what can you see in the information given?
STEP 1 – WRITE THE INTRODUCTION
Write your own introduction of one or two sentences, paraphrasing the question, using synonyms where you can.
STEP 2 – WRITE AN OVERVIEW
Write the overview – start this paragraph with the word ‘Overall...’ and write one or two sentences that describe the main features of the information presented in the bar chart.
STEP 3 – WRITE THE MAIN BODY PARAGRAPHS
Write two main body paragraphs, going into detail and giving specific information about the chart. Remember to include data to support your findings. For example, look for the highs and lows and any major increases or decreases over time.
STEP 4 – CHECK YOUR WORK
When you have completed the essay, check it for any errors, spelling or grammar. Then check to see if you have included linking words that connect the information together, making it easy to read. For example, using the word ‘Overall..’ at the beginning of the overview paragraph. You can also use words like – on the one hand, on the other hand, furthermore, however, in addition, finally etc.
MODEL ANSWER
To view the model answer for this question please click the button below >>
We hope you found this post useful in helping you to study for the IELTS Test. If you have any questions please let us know in the comments below or on the Facebook page.
The best way to keep up to date with posts like this is to like us on Facebook, then follow us on Instagram and Pinterest.
If you need help preparing for the IELTS Test, join the IELTS Achieve Academy and see how we can assist you to achieve your desired band score. We offer an essay correction service, mock exams and online courses.
How to Describe Process Diagrams
Process diagrams show the stages involved in making something, or how a natural or mechanical process works. Unlike other Task 1 questions, process diagrams require you to describe a sequence rather than compare data.
Essential Process Vocabulary
Stage
Language
Beginning
The process begins with…, The first stage involves…, Initially…
Sequence
Following this…, Subsequently…, After that…, The next step is…
Simultaneous
At the same time…, Meanwhile…, Concurrently…
Result
This results in…, This produces…, As a result…
Final stage
Finally…, In the last stage…, The process concludes when…
Structure Guide
Introduction: Paraphrase what the diagram shows (e.g., “The diagram illustrates the process by which cement is manufactured”).
Overview: State how many stages there are and whether the process is linear or cyclical.
Body paragraphs: Describe the stages in order, grouping related steps logically.
Tips for Band 7+
Use the passive voice throughout (e.g., “the materials are heated” not “someone heats the materials”)
Include sequencing connectors to show the order clearly
Count the stages and mention the total in your overview
Do not speculate about reasons — only describe what the diagram shows
Originally published on IELTS Achieve. Last reviewed 3 July 2026.
Step-by-step guide to answering this type of IELTS Writing Task 1 question. Covers structure, key language, and band-scoring criteria.
Originally published May 2017. Last reviewed 3 July 2026.
This post will help you to write a successful line graph essay, there is a model answer for you to compare your work to at the end of the post.
Remember that your essay should have a minimum of 150 words and ideally should be completed in 20 minutes.
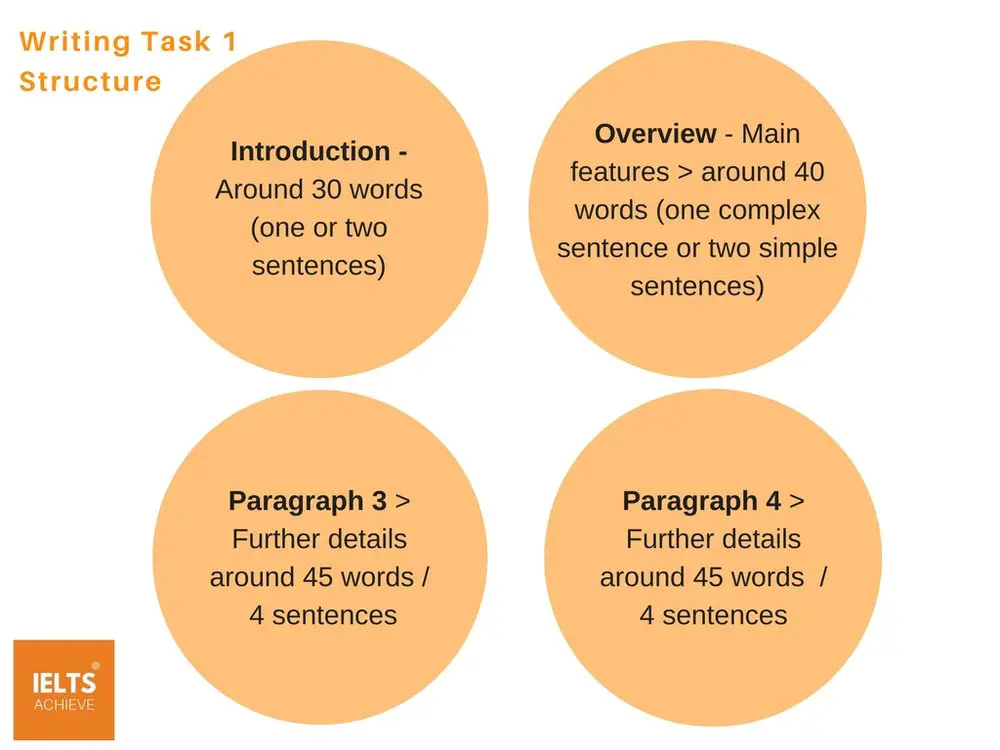
Line Graph Essay Structure
The writing task 1 essay should be as follows:
Sample Question: Line Graph
Read the question below carefully, what can you see in the information given?
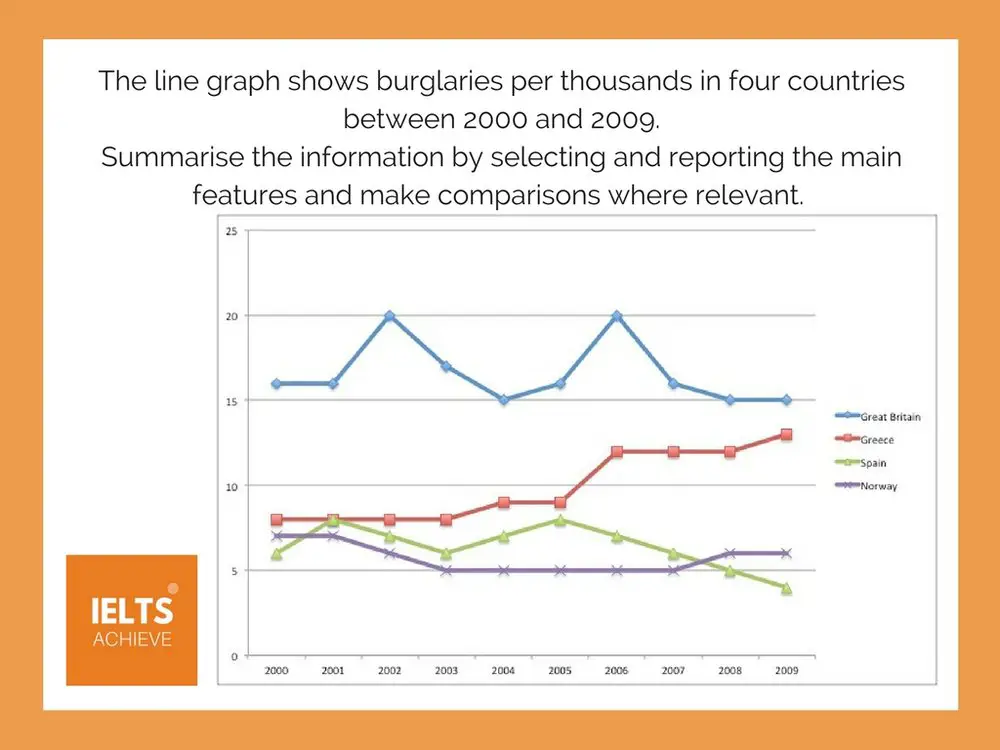
The line graph shows burglaries per thousand in four countries between 2000 and 2009. Summarise the information by selecting and reporting the main features and make comparisons where relevant.
STEP 1 – WRITE THE INTRODUCTION
Write your own introduction of one or two sentences, paraphrasing the question, using synonyms where you can.
STEP 2 – WRITE AN OVERVIEW
Write the overview – start this paragraph with the word ‘Overall...’ and write one or two sentences which describe the main features of the information presented in the line graph.
STEP 3 – WRITE THE MAIN BODY PARAGRAPHS
Write two main body paragraphs, going into detail and giving specific information about the graph. Remember to include data to support your findings. For example, look for the highs and lows and any major increases or decreases over time.
STEP 4 – CHECK YOUR WORK
When you have completed the essay, check it for any errors, spelling or grammar. Then check to see if you have included linking words that connect the information together, making it easy to read. For example, using the word ‘Overall..’ at the beginning of the overview paragraph. You can also use words like – on the one hand, on the other hand, furthermore, however, in addition, finally etc.
Model Answer for Line graph essay
To view more model answer for similar question please click the link below:
The graph illustrates comparative statistics on the number of burglaries in four countries (Great Britain, Greece, Spain and Norway) over a 10-year period (2000-2009). The units of thefts were measured in thousands.
Overall, the highest recurrence of burglary was in Great Britain, which was fairly high from 2000-2009 in comparison to the other countries, while the lowest incidence when the study began in 2000 was in Spain. It can be seen that in 2009 Spain reported slightly lower figures than the other four countries.
The graph shows that Great Britain’s burglaries were consistently high, never below the 20,000 mark, though the trend fluctuates over the 10-year period. According to the data, the country experienced the highest number of thefts during 2002 (20,000) and 2006 (20,000). However, it experienced its lowest amount stolen in 2009 at approximately 15,000.
Similarly, Spain experienced fluctuating trends, but on the opposite side of the spectrum as it reported the least amount of burglaries in 2000 (6,000) with frequency varying over the years and finally reporting a decline in 2009 (4,000). However, other notable statistics are Greece’s upward trend in the number of burglaries, which started in 2000 (8,000) and finally peaked at 14,000 during 2009. Norway is also noteworthy for having considerably low thefts over the course of 10 years compared to the other countries, dropping sharply in 2003, but increasing slightly from there, finally peaking at 6,000 slightly higher than Spain.
Step-by-step guide to answering this type of IELTS Writing Task 1 question. Covers structure, key language, and band-scoring criteria.
Originally published May 2017. Last reviewed 3 July 2026.
This post will help you to write a successful pie charts essay, there is a model answer for you to compare your work to at the end of the post.
Remember that your essay should have a minimum of 150 words and ideally should be completed in 20 minutes.
The writing task 1 essay structure should be as follows >>
Question
Read the question below carefully, what can you see in the information given?
Step 1 – Write the introduction
Write your own introduction of one or two sentences, paraphrasing the question, using synonyms where you can.
Step 2 – Write an overview
Write the overview – start this paragraph with the word ‘Overall...’ and write one or two sentences which describe the main features of the information presented in the charts.
Step 3 – Write the main body paragraphs
Write two main body paragraphs, going into detail and giving specific information about the charts. Remember to include data to support your findings. For example, look for the highs and lows and any major increases or decreases over time.
Step 4 – Check your work
When you have completed the essay, check it for any errors, spelling or grammar. Then check to see if you have included linking words that connect the information together, making it easy to read. For example, using the word ‘Overall..’ at the beginning of the overview paragraph. You can also use words like – on the one hand, on the other hand, furthermore, however, in addition, finally etc.
Model Answer
To view the model answer for this question please click the button below >>
We hope you found this post useful in helping you to study for the IELTS Test. If you have any questions please let us know in the comments below or on the Facebook page.
The best way to keep up to date with posts like this is to like us on Facebook, then follow us on Instagram and Pinterest.
If you need help preparing for the IELTS Test, join the IELTS Achieve Academy and see how we can assist you to achieve your desired band score. We offer an essay correction service, mock exams and online courses.
How to Describe Tables in IELTS Writing Task 1
Table questions present numerical data organised in rows and columns. Your task is to identify, compare, and summarise the key features without describing every single number.
Strategy for Table Questions
Scan for patterns: Look for the highest and lowest values, trends over time, and significant differences between categories.
Select key data: You cannot mention every number. Choose the most significant figures that illustrate trends or comparisons.
Group information: Organise your body paragraphs by theme (e.g., countries that increased vs. decreased) rather than going row by row.
Include specific figures: Support your observations with actual numbers from the table.
Useful Language for Tables
Function
Phrases
Highest value
The highest figure was recorded for…, X had the largest proportion at…
Lowest value
The lowest rate was seen in…, X accounted for the smallest share…
Comparison
X was significantly higher than Y…, Compared with X, Y was…
Approximate data
roughly, approximately, just over, just under, around
Common Mistakes
Describing every number in the table instead of selecting key data
Failing to make comparisons between categories
Writing without an overview paragraph
Using imprecise language when exact figures are available
Originally published on IELTS Achieve. Last reviewed 3 July 2026.
Step-by-step guide to answering this type of IELTS Writing Task 1 question. Covers structure, key language, and band-scoring criteria.
Originally published May 2017. Last reviewed 3 July 2026.
Here are a number of writing task 1 sample essays for you to look at. Take a look through the questions and sample answers and compare them to your own work. Are they similar? Do you find them easy to understand? Do they answer the question? Can you see how the information has been structured?
It is important for you to look at sample essays when you are studying to see if your work is on the way to becoming a band score 7 or higher.
Read through the essay feedback and see why the essays have achieved a band score 9. The band 9 criteria are also at the end of this post.
Sample Essay 1 – Pie Charts
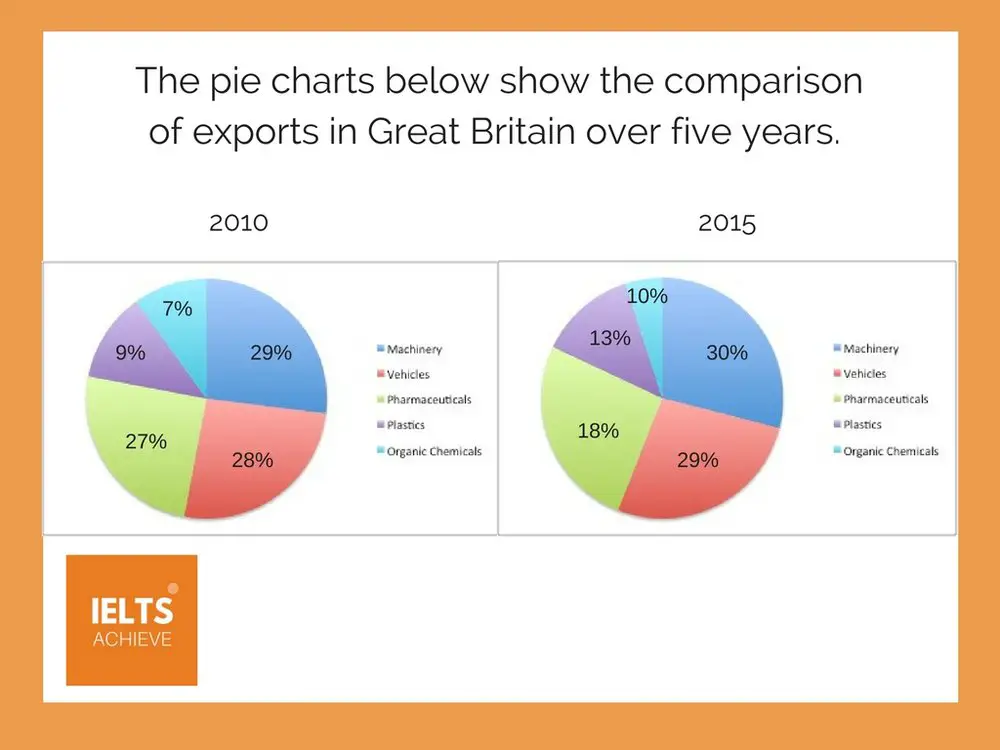
The pie charts show the ratio of goods shipped from Great Britain from 2010 to 2015. The products are measured by percentage.
Overall, over the five-year period, the most exported goods were machinery and vehicles. These two types of goods were predominantly wanted out of all of the categories. The least amounts of goods exported were plastics and organic chemicals. Minimal changes occurred over the selected time period.
On the one hand, machinery exports have a small increase as the amounts moved are 29% and 30% respectively. The percentage of vehicles shipped only rose slightly by 1% from 2010 (28%) to 2015 (29%). The machinery and vehicles export pattern remained steady throughout the five years.
On the other hand, the diagrams illustrate an increasing rise in the production of plastics at over 4% since 2010. Furthermore, the most relevant feature is the increase in the export of organic chemicals from 2010 (7%) to 2015 (10%). There is a huge difference in the production of pharmaceuticals, due to the fact that it experienced a decrease from 2010 (27%) to 2015 (18%).
(Word Count = 180 / Band Score 9)
Task Achievement – The answer provides a paraphrased question, to begin with, followed by an overview that gives the reader key information. The information selected is relevant.
Coherence and Cohesion – The answer has been divided into clear logical paragraphs.
Lexical Resource – There is evidence of paraphrasing, synonyms and some less common words.
Grammatical Range and Accuracy – The answer has no grammatical errors. The sentences are mainly made up of multiple clauses and have a variety of structures.
TIP >> Remember to identify two or three main features and write about those. You don’t need to write about everything you see in order to gain a high band score.
Sample Essay 2 – Line Graph Showing Future Trends
The line graph presented depicts the loan status of the Royal Bank of Scotland between the years 2012 to 2022. It is measured in millions of pounds sterling.
Overall, it can be seen that while student loans and mortgages are predicted to increase simultaneously over the period, auto loans and personal loans have highs and lows, therefore remaining much lower in comparison.
Firstly, it is clear that student loans and mortgages are following a very similar pattern over the years. Student loans stood at just under 1.500 million in 2012, noticeably, being the highest of the four groups. Though they remained constant up to 2013, they are expected to climb steadily to approximately 2.5 billion in 2022. Like the student loans, mortgages are predicted to follow a similar pattern and increase.
Secondly, auto loans are expected to show abnormalities of both highs and lows during the years. Although having initially grown, they will drop to 700 million in 2016, before reaching the peak of about 1500 million in 2020. Auto loans will end close to the amount where they began.
Finally, personal loans were staged at the lowest level of the four groups, at under 500 million in 2012. Despite climbing up and overtaking auto loans briefly in 2016 to about 800 million, this level will continue decreasing until 2022 to 400 million.
(Word Count = 223 / Band Score 9)
Task Achievement – The answer provides a paraphrased question, to begin with, followed by an overview that gives the reader key information. The final sentence has a future prediction.
Coherence and Cohesion – The answer has been divided into clear logical paragraphs. The overview explains the trends generally then the specific information is written about in the main body paragraphs.
Lexical Resource – There is evidence of paraphrasing, synonyms and some less common words. Specific vocabulary used to describe change over time has been used.
Grammatical Range and Accuracy – The answer has no grammatical errors. The sentences have a variety of structures.
TIP >> Remember to end the essay with a prediction for the future, after looking at the present.
Sample Essay 3 – Process
The illustration shows the whole process of how a hydroelectric dam manufactures electricity from water.
Overall the main element of the procedure is the flow of water, making a reservoir of water, this is the first step until the last step where the power is produced and distributed. There are 5 main steps in this process.
To begin, a body of water is stored in a large water reservoir holding the water until it goes into the intake. The dam will then control the flow of water to the intake. After that, water will flow to a cylindrical passage called a penstock, making it flow with a strong pressure until it reaches the turbine. Next, the current of the flowing water from the river passing through the penstock will maintain the turbine’s rotation.
Subsequently, the rotation of the turbine would produce energy that will pass through a generator until electricity is produced. The generator is inside of the powerhouse, where long distance power lines are connected. Finally, from the generator, electricity is then transmitted to long distance power lines.
(Word Count = 178 / Band Score 9)
Task Achievement – The answer provides relevant information, describing the process through every stage. The overview gives clear information, leading into the main body paragraphs.
Coherence and Cohesion – The answer has been divided into clear logical paragraphs, with clear cohesion between them with the addition of time connectors (after that, next, subsequently, finally).
Lexical Resource – There is evidence of paraphrasing, synonyms and some less common words.
Grammatical Range and Accuracy – The answer has no grammatical errors. The sentences are mainly made up of multiple clauses and have a variety of structures. There are no spelling mistakes and punctuation is correct.
TIP >> Write a good overview, with how many stages the process has, starting with….. and ending with……then go into the main detail of describing the process into the main body paragraphs.
TIP >> Describe the process and lead the reader through it by using time connectors.
Sample Essay 4 – Line Graph
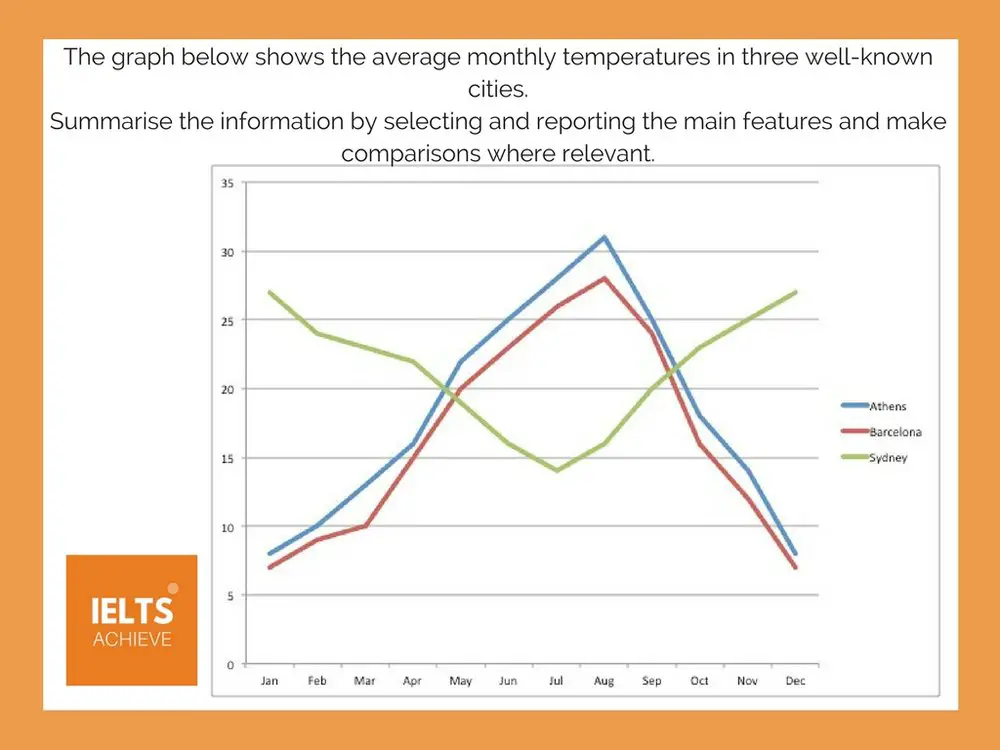
The line graph illustrates the climate conditions in Athens, Barcelona, and Sydney over the period of one year.
Overall, it can be seen that generally, the cities of Athens and Barcelona have a similar temperature movement in comparison with Sydney. Both Athens and Barcelona’s temperatures peak during the summer months of June, July and August, while Sydney has lower temperatures during those three months. In contrast, Sydney’s highest temperatures are when Athens and Barcelona have their lowest.
To begin with, Athens has approximately 8 degrees of temperature in January with a gradual increase to 25 degrees in June. However, this trend slowly declined each month reaching close to 8 degrees by December. Similarly, Barcelona had a similar trend but started with just a little below 7 degrees in January. Nonetheless, after the succeeding months, there had been a steep incline to the temperature that peaked at around 28 degrees in August. But, a sudden drop to nearly 5 degrees per month was experienced for the remaining months until December with exact 6 degrees.
In contrast to Athens and Barcelona, Sydney’s temperature was just a little over 27 degrees in January but slowly decreased in the following months, reaching the lowest point at 14 degrees in July. Finally, this average monthly temperature incrementally increased each month, ending with the same temperature of 25 degrees in December.
(Word Count = 225 / Band Score 9)
Task Achievement – The answer provides a paraphrased question, to begin with, followed by an overview that gives the reader key information.
Coherence and Cohesion – The answer has been divided into clear logical paragraphs. The overview explains the trends generally, then the specific information is written about in the main body paragraphs.
Lexical Resource – There is evidence of paraphrasing, synonyms and some less common words.
Grammatical Range and Accuracy – The answer has no grammatical errors. The sentences are mainly made up of multiple clauses and have a variety of structures.
TIP >> Remember to compare and contrast information, using cohesive devices, such as overall, to begin with, similarly and finally.
Sample Essay 5 – Table
The table illustrates the percentage of people who decided to shop in a humane way from 2012 to 2014.
Overall, it is evident that the free range/organic and fairtrade experienced declines in numbers of shoppers, whereas the pre-loved clothes became the most wanted items during the same period.
To begin, the proportion of people buying ethical clothing fell from just over half to only 20% or one fifth from 2012 to 2014. Similarly, the relative number of people buying Fairtrade items — just under one quarter — dropped by half in the same period. As for the free range and organic products, the relatively small percentage of people buying this type of product in 2012 (12%) also fell, although not significantly.
However, while the other three types of ethical shopping declined in importance, the opposite was true in the case of pre-loved clothes. In fact, while only a small minority of 12% were interested in purchasing these in 2012, this figure increased to well over half of all shoppers during the following two years reaching 58% in 2014.
(Word Count = 178 / Band Score 9)
Task Achievement – The answer provides a paraphrased question, to begin with, followed by an overview that gives the reader key information that is supported by data from the table.
Coherence and Cohesion – The answer has been divided into clear logical paragraphs. The overview explains the trends generally, then the specific information is written about in the main body paragraphs.
Lexical Resource – There is evidence of paraphrasing, synonyms and some less common words.
Grammatical Range and Accuracy – The answer has no grammatical errors. The sentences are mainly made up of multiple clauses and have a variety of structures.
TIP >> Remember to highlight any trends that stand out, for example in this table, the number of people buying pre-loved clothes in 2014.
Writing Task 1 Band Score 9 Criteria >>
We hope you found this post useful in helping you to study for the IELTS Test. If you have any questions please let us know in the comments below or on the Facebook page.
The best way to keep up to date with posts like this is to like us on Facebook, then follow us on Instagram and Pinterest.
If you need help preparing for the IELTS Test, join the IELTS Achieve Academy and see how we can assist you to achieve your desired band score. We offer an essay correction service, mock exams and online courses.
Step-by-step guide to answering this type of IELTS Writing Task 1 question. Covers structure, key language, and band-scoring criteria.
Originally published May 2017. Last reviewed 3 July 2026.
A question on the IELTS academic writing test that is becoming more common, asks the candidate to write about and describe a process.
You may have a natural or a man made process question. In this post we will look at how to write this type of essay, with structure help, vocabulary and sample answers.
Writing Task 1 – Process Essay Structure >>
Paragraph 1 – Paraphrase the question
When writing your own introduction of one or two sentences paraphrase the question and add detail.
Paragraph 2 – Overview of the main features
You need to be able to give a broad summary of the information. This is best started with – Overall.…… then giving details of the main features you can see. You can write this in one or two sentences, which describe the main features of the information that is presented in the process. Think about the number of stages that are in time order, what is happening at the beginning? What is happening at the end? How many stages are there?
Paragraph 3 – Specific details
Write about the process from the beginning, explaining what is happening throughout each stage.
Paragraph 4 – Specific details
Write about the process through to the end, including time connectors that lead the reader through each step of the process clearly.
TIP >> When describing a process you should write using the passive voice, focussing on the activities not the person who is doing them.
Time Connectors >>
The words below can help you to connect the stages of the process you are writing about.
Writing Task 1 Process Sample Essays >>
Here are two sample essay questions and answers for you to look at. Review the language used, the essay structure, the stages and how it has been written.
Sample Process Essay 1
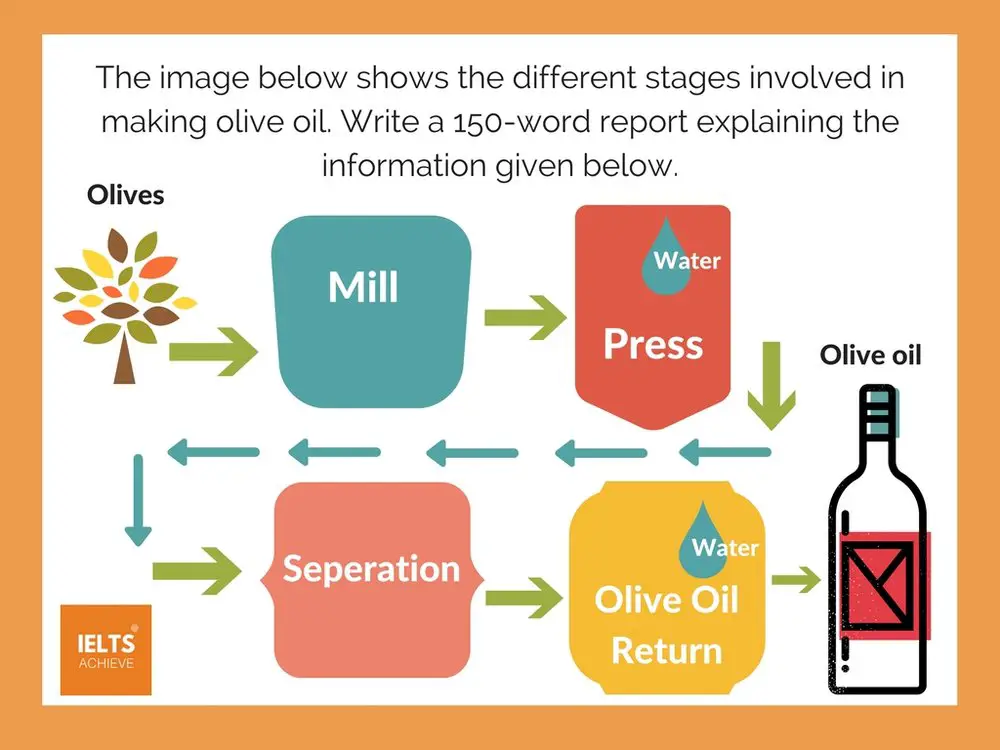
The diagram presents how olive is produced with the use of different equipment.
Overall, olive oil production involves four main stages and needs different equipment to achieve its desired appearance and flavour. The process starts with the breakdown of the olives after collection in a mill and culminates with storing the product in bottles until it is ready for consumption.
The process of making olive oil starts when olives are ground in a mill to create a paste. After the paste has been spread onto mats, this is transferred into a press where water is added. Following this procedure, the mashed olive paste is placed into a separation container where the oil goes through a natural separation process from vegetable waters.
After separation, the mixture goes into the olive oil return, where more water is added and wastewater is subsequently drained. Once this process has ended, the olive oil is ready to be bottled, where it is stored for a period of time known as the clarification stage. Finally, once this time has passed the oil is ready to be used.
(Word Count = 181 / Band Score 9)
Task Achievement – The answer provides relevant information, describing the process of how olive oil is made. The overview gives clear information, leading into the main body paragraphs.
Coherence and Cohesion – The answer has been divided into clear logical paragraphs, with clear cohesion between them with the addition of time connectors (after, following this, finally).
Lexical Resource – There is evidence of paraphrasing, synonyms and some less common words.
Grammatical Range and Accuracy – The answer has no grammatical errors. The sentences are mainly made up of multiple clauses and have a variety of structures. There are no spelling mistakes and punctuation is correct.
TIP >> Write a good overview, with how many stages the process has, starting with and ending with.
TIP >> Describe the process and lead the reader through it by using time connectors.
Sample Process Essay 2
The picture illustrates the process of making paper from the trees that have been collected.
Overall, it can be observed that there are eight stages in this process, beginning with the collection of trees from the forest and ending with the paper being made in the paper making machine.
To begin with, timber is collected from the forest and taken to be debarked. After the wood has been stripped bare, it enters the chipping machine, where it is chopped up into tiny pieces. From the chipping machine, the wood enters into three separate stages. First, the wood chips are put through the mechanical pulping process, where they are ground and smashed into pulp. Then they have a chemical pulping, going next into the hydra-pulper.
In the subsequent stage, the mixture goes through to be screened and cleaned, to filter any lumps or waste from the pulp. Lastly, the pulp is entered into the paper making machine, where it is pressed to make sheets of paper. The paper is then stored and stacked, ready for shipping and to be used.
(Word Count = 179 / Band Score 9)
Task Achievement – The answer provides relevant information, describing the process of how paper is made. The overview gives clear information, leading into the main body paragraphs.
Coherence and Cohesion – The answer has been divided into clear logical paragraphs, with clear cohesion between them with the addition of time connectors (first, then, subsequently).
Lexical Resource – There is evidence of paraphrasing, synonyms and some less common words.
Grammatical Range and Accuracy – The answer has no grammatical errors. The sentences are mainly made up of multiple clauses and have a variety of structures. There are no spelling mistakes and punctuation is correct.
TIP >> Write a good overview, with how many stages the process has, starting with and ending with.
TIP >> Describe the process and lead the reader through it by using time connectors.
Writing Task 1 Band Score 9 Criteria >>
We hope you found this post helpful in helping you to study for the IELTS Test. Let us know in the comments or on the Facebook page if you have any questions. The best way to keep up to date with posts like this is to like us on Facebook, and then follow us onInstagramand Pinterest. We offer essay correction services, mock exams, and online courses. If you need help preparing for the IELTS Test, join the IELTS Achieve Academy and see how we can help you achieve your desired band score faster.
Step-by-step guide to answering this type of IELTS Writing Task 1 question. Covers structure, key language, and band-scoring criteria.
Originally published May 2017. Last reviewed 3 July 2026.
One of the questions you may have on your IELTS writing task 1 test is a maps question. These are not as common as the charts, but it is worth practising.
In this post, we will look at how to structure your essay for this type of question, how to describe both the general and specific changes, vocabulary and sample answers.
There are a few different types of map question, one will ask you to describe a map in the present, you may be asked to describe two maps, one in the present and one in the future and lastly you may be given a question that asks you describe two maps, one in the past and one in the present.
These questions will require you to show your knowledge of vocabulary and grammar, using the correct tense. You will also use the passive in your writing.
Writing Task 1 – Maps Essay Structure >>
Paragraph 1 – Paraphrase the question
When writing your own introduction of one or two sentences paraphrase the question and add detail.
Paragraph 2 – Overview of the main features
You need to be able to give a broad summary of the information. This is best started with – Overall……. then giving details of the main features you can see. You can write this in one or two sentences, which describe the main features of the information that is presented in the maps. Think about the main changes that you can see have they improved anything? Have they built anything in an area that was the countryside before? Have there been any dramatic changes?
Paragraph 3 – Specific details of the main features
Write about the specific details that you can see – looking closely at the main features and include detail, then make any comparisons if relevant.
Paragraph 4 – Specific details of the main features
Write about the specific details that you can see – looking closely at the main features and include detail, then make any comparisons if relevant.
Describing Changes To A Map >>
Look carefully at the maps you have in front of you (above), have there been a lot of changes? What are the main changes?
The maps are normally labelled for you, with buildings, features and sometimes locations. Below is an example of how to describe changes;
Since 2010, all of the buildings on the Liverpool John Moores University campus have changed. There are quite a few improvements to both buildings and access.
Providing More Detail >>
Describe more differences between the maps, looking at the past and the present. What has stayed the same and what has changed?
The library has been renovated to include IT facilities.
The former chemistry, biology and physics blocks have been demolished and replaced with one large science block.
The car park has been removed and a brand new lecture theatre constructed.
The admin building has been made smaller, to allow better footpath access.
The large car park seen in 2010 has been converted into a bus station.
How To Describe General Changes >>
The words and phrases below can help you to describe the general changes you can see in the maps, for example;
Over the period of 2010 to the present, the area had gradually changed.
The campus changed rapidly, during the six-year period.
During the six-year period, many buildings had been renovated.
Over the last 6 years, there was a large area of redevelopment near the science blocks.
Choose two or three noticeable differences in the map and write a statement for each similar to the examples above, this will become your overview paragraph.
TIP >> Remember that you must report the information you see objectively, you don’t give your opinions or any extra unnecessary information.
How To Describe Locations >>
When describing where things are on the map, it is better to use north, south, east, west, rather than say to the right or to the left. For example;
The library to the north-west of the campus was renovated.
The admin building to the south-east of the campus was relocated.
The small car park to the north-east of the campus was redeveloped into a lecture theatre.
The large car park to the south-west of the campus was constructed into a bus station.
Writing Task 1 Maps Sample Essays >>
Here are two sample essay questions and answers for you to look at. Review the language used, the essay structure, the information gathered and how it has been written. The two essays you see here are from former students who passed their IELTS tests in 2017.
Sample Map Essay 1
The map represents the city of Leeds including two areas, which were suggested as a potential place to build a new shopping mall. The sites are named S1 and S2.
Overall, both of the areas are situated within close proximity of the city centre, although S1 is located in the north of the city centre and S2 is in the south.
On the one hand, area S1 is near to a road, a river and a railway, which form the boundary of the S1 site. Part of a residential area can be found to the north-west of S1’s territory. If the shopping mall is to built on S1, it will be close to this large housing estate, therefore providing easy access to the residents and those who live/work in the city centre. S1 also has easy transport links, being close to both the railway line and the road.
On the other hand, a road on the west side makes up the boundaries of the S2 area and one of the forks in the road forms the northern border. A railway passes through the S2 area and on the right side of this railway there is an industrial estate. S2 is closer to the industrial area than the housing estate. The main road runs through the city and is close to both sites, providing good access. However, a large golf course and park are in the west of the city, which would stop this area from being used as a site.
(Word Count = 250 / Band Score 9)
Task Achievement – The answer provides relevant information, summarising why each site would or would not be ideal for the shopping mall location. The areas are both described in detail, with the relevant information given.
Coherence and Cohesion – The answer has been divided into clear logical paragraphs, with clear cohesion between them with the addition of linking words (overall, on the one hand, on the other hand, therefore).
Lexical Resource – There is evidence of paraphrasing, synonyms and some less common words. They have used words such as transport links, northern border and residential area, that are not included on the map.
Grammatical Range and Accuracy – The answer has no grammatical errors. The sentences are mainly made up of multiple clauses and have a variety of structures. There are no spelling mistakes and punctuation is correct.
TIP >> Remember to compare the areas you are looking at and identify the main changes that you can see. Think about why those things seem important and if there is a common theme. This will help you to gain a high score.
The images show how the planned new improvements will not only change the look but also improve the functionality of Park Avenue.
Overall, the most important change will be the addition of safety measures and the appearance of foliage amid the initial monotonous city design. The sidewalks will be wider on both sides of the road and bicycle lanes will be added, while a pedestrian crossing will also be constructed at the bottom of the street. The crossing will have an island where pedestrians can wait.
The wider sidewalks will ensure that people can enjoy their strolls and joggers will have a place to run without bumping into each other. The bike lanes reduce traffic problems that might arise, when cyclists are caught in traffic or when they try to move fast on the sidewalks. So this change raises the degree of safety and comfort for everyone.
The new pedestrian crossing is making the area safe for the community and is very clear for drivers. This will be safer for people to cross the road, as before there was no safe way of crossing the road. The trees planted, will not only improve the aesthetics of the area but will help to reduce CO2 emissions and offer some welcomed shade during hot summer days.
(Word Count = 213 / Band Score 9)
Task Achievement – The answer provides relevant information, summarising the changes. The suggested changes have been described throughout the essay. They are given a clear breakdown in the overview, with further explanations in the main body paragraphs, not only of the change but of their purpose and function.
Coherence and Cohesion – The answer has been divided into clear logical paragraphs, with the detail of safety measures and how it will affect the environment.
Lexical Resource – There is evidence of paraphrasing, synonyms and some less common words. They have used words that are not included on the map.
Grammatical Range and Accuracy – The answer has no grammatical errors. The sentences are have a variety of structures. There are no spelling mistakes and punctuation is correct. The tenses used are clear when referencing the present and the future.
TIP >> Remember to compare the maps you are looking at and identify the main changes that you can see. Think about why those things seem important and if there is a common theme. This will help you to gain a high score.
Writing Task 1 Band Score 9 Criteria >>
We hope you found this post useful in helping you to study for the IELTS Test. If you have any questions please let us know in the comments below or on the Facebook page.
The best way to keep up to date with posts like this is to like us on Facebook, then follow us on Instagram and Pinterest.
If you need help preparing for the IELTS Test, join the IELTS Achieve Academy and see how we can assist you to achieve your desired band score. We offer an essay correction service, mock exams and online courses.