Step-by-step guide to answering this type of IELTS Writing Task 1 question. Covers structure, key language, and band-scoring criteria.
Originally published May 2018. Last reviewed 3 July 2026.
In this post, we will look at a Writing Task 1 Academic table essay example from the IELTS writing task 1 Academic Test. Students often ask if the questions are repeated year after year and the answer is no, but the type of chart, graph or table can be.
There are so many questions written each year, you may find you practice answering various questions on different topics. It is best practice to learn how to answer each one of the various types of writing task 1 questions, from bar charts, line graphs, maps, process etc.
If you would like to learn how to structure a charts, graphs, table essay please click the button below >
Take a look at the IELTS Writing Task 1 Academic essay example below >>
*This table question and answer were provided by a student. IELTS Achieve did not design this question*
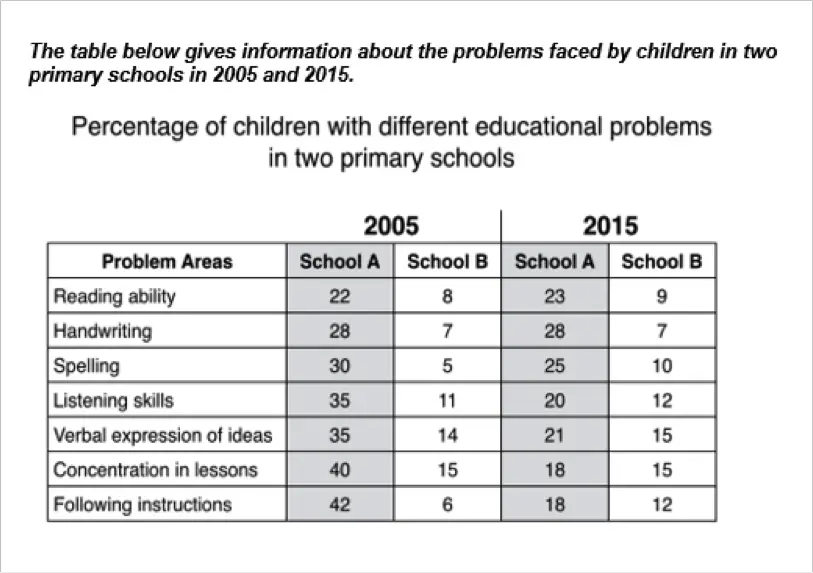
The table illustrates the comparative statistics about the seven hindrances encountered by students from two different elementary schools in 2005 and 2015. The units of measurement are in percentage.
Overall, The survey started in the year 2005 which revealed that not following instructions had the highest fraction while poor reading ability received the lowest percentage in students from school A. Difficulty concentrating in lessons garnered the topmost proportion, while problems in spelling obtained the lowest section in children from school B. After 10 years, handwriting took the top spot in school A, whereas both concentration difficulties and verbal expression got the top spot in school B.
On the one hand, in the year 2005, not following instructions acquired the highest proportion with 40% from school A followed by problems in concentration, troubles in verbal expressions and lacking listening skills with 40% and both 35% respectively, whereas poor reading ability got the lowest percentage. In school B, having a hard time concentrating is the topmost problem with 15 % followed by verbal expression obstacles, poor listening skills and problems in reading with 14%, 11% and 8% accordingly.
On the other hand, after 10 years, trouble with handwriting got the highest number with 28% from school A. Just trailing behind were spelling struggles and weak reading ability with 25% and 23% correspondingly. In school B both problems in verbal expression of ideas and concentration lessons shared the top spot with 15% next to it are lacking in listening skills and weak reading ability with 10% and 9% respectively.
Finally, not following instructions and concentration difficulties received the lowest in school A with both 18% whereas poor reading ability obtained the lowest number with only 9% in school B.
Word count - 286 / Band score 8
*This is a little long for a writing task 1 essay - do you think some of the information could have been edited? What would you have cut out of the essay? Answer in the comments below*
Task Achievement - The answer provides a paraphrased question, to begin with, followed by an overview that gives the reader key information.
Coherence and Cohesion - The answer has been divided into clear logical paragraphs.
Lexical Resource - There is evidence of paraphrasing, synonyms and some less common words.
Grammatical Range and Accuracy - The answer has no grammatical errors. The sentences are mainly made up of multiple clauses and have a variety of structures.
We hope you found this post useful in helping you to study for the IELTS Test. If you have any questions please let us know in the comments below or on the Facebook page.
The best way to keep up to date with posts like this is to like us on Facebook, then follow us on Instagram and Pinterest.
If you need help preparing for the IELTS Test, join the IELTS Achieve Academy and see how we can assist you to achieve your desired band score. We offer an essay correction service, mock exams and online courses.
Step-by-step guide to answering this type of IELTS Writing Task 1 question. Covers structure, key language, and band-scoring criteria.
Originally published May 2018. Last reviewed 3 July 2026.
In this post, we will look at a Writing Task 1 Academic table essay: European Household Income example from the IELTS writing task 1 Academic Test.
If you would like to learn how to structure a chart, graph, table essay please click the button below:
Take a look at the IELTS Writing Task 1Table Essay: European Household Income example below:
*This table question and answer were provided by a student. IELTS Achieve did not design this question*
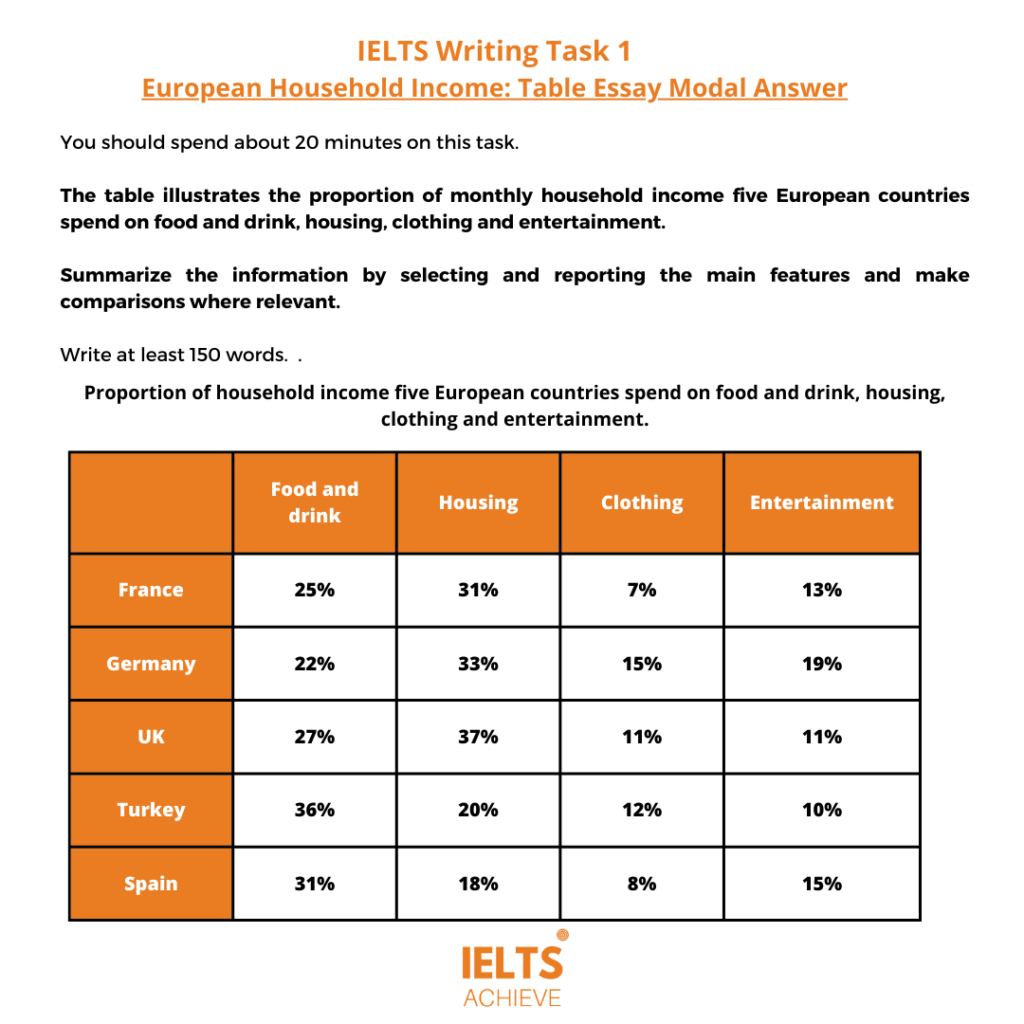
You should spend about 20 minutes on this task. The table illustrates the proportion of monthly household income five European countries spend on food and drink, housing, clothing and entertainment. Summarize the information by selecting and reporting the main features and make comparisons where relevant.
Write at least 150 words.
The proportion of monthly household income five European countries spend on food and drink, housing, clothing and entertainment.
The table shows the comparative figures based on four monthly expenditures namely; food and drink, housing, clothing and entertainment in the following countries; France, Germany, The UK, Turkey and Spain. Overall, Turkey had the highest percentage of food and drink, while the UK spent most of their money on housing, Germany got the top spot in clothing and entertainment respectively. On the one hand, based on food and drink spending with 36% Turkey had the highest figure followed by Spain and The UK with 31% and 27 % correspondingly, whereas France had 25% and lastly the Germans with 22%. In terms of housing, the British spent the highest amount of 37% and the Spanish received the lowest with 18%. On the other hand, looking at clothing expenses, the Germans spent the most with 15% while the citizens of Turkey, the British people and the Spanish trailed behind with 12%, 11% and 8% respectively, while the French had the lowest clothing expenditure with only 7%. Finally, with regards to entertainment, Germany produced the highest number with 19% followed by Spain, France and the UK with 15%, 13% and 11% accordingly, as Turkey got the lowest with 10%.
Word count - 195 / Band score 8
Instructor Feedback on Modal Answer: IELTS Writing Task 1
Task Achievement: The answer provides a paraphrased question, to begin with, followed by an overview that gives the reader key information. Coherence and Cohesion: The answer has been divided into clear logical paragraphs. Lexical Resource: There is evidence of paraphrasing, synonyms and some less common words. Grammatical Range and Accuracy: The answer has no grammatical errors. The sentences are mainly made up of multiple clauses and have a variety of structures.
We hope you found this post helpful in helping you to study for the IELTS Test. Let us know in the comments or on the Facebook page if you have any questions. The best way to keep up to date with posts like this is to like us on Facebook, and then follow us onInstagramand Pinterest. We offer essay correction services, mock exams, and online courses. If you need help preparing for the IELTS Test, join the IELTS Achieve Academy and see how we can help you achieve your desired band score faster.
Step-by-step guide to answering this type of IELTS Writing Task 1 question. Covers structure, key language, and band-scoring criteria.
Originally published May 2018. Last reviewed 3 July 2026.
In this post, we will look at a Writing Task 1 Academic table essay example from the IELTS writing task 1 Academic Test. Students often ask if the questions are repeated year after year and the answer is no, but the type of chart, graph or table can be.
There are so many questions written each year, you may find you practice answering various questions on different topics. It is best practice to learn how to answer each one of the various types of writing task 1 questions, from bar charts, line graphs, maps, process etc.
If you would like to learn how to structure a charts, graphs, table essay please click the button below >
Take a look at the IELTS Writing Task 1 Academic essay example below >>
*This table question and answer were provided by a student. IELTS Achieve did not design this question*
The table illustrates the comparative figures based on four phases of the lives of citizens from five countries namely Bangladesh, Bolivia Egypt, Indonesia and the USA.
Overall, The United States of America got the highest number on the GNP and caloric intake per person. They also have the longest life expectation and the lowest infant death rate, whereas Bangladesh obtained the lowest figure in the same category. In addition, they have the shortest life expectancy and received the highest numbers of mortality rate in infants.
On the one hand, based on the GNP in 1982 using US dollars as the basis, the Americans got the highest figure with 13160 followed by Egypt and Indonesia with 690 and 580 respectively, whereas Bolivians got 570 and lastly with 140 are the Bangladeshis. The USA yet again have the highest daily caloric intake per person with 3653 while Bangladesh got the lowest daily calorie consumption per citizen with 1877.
On the other hand, looking at the life expectancy, Americans outlive the other citizens from the four countries with 74 as the average life expectation. Just trailing behind were Egypt, Bolivia and Indonesia with 56, 49 and 40 correspondingly, whereas Bangladesh got the lowest position with only an average of 40 years old.
Finally, with regards to the infant mortality rate, Bangladesh received the highest rate with 132 deaths per 1000 live births followed by Bolivians, Egyptians and Indonesians with 124, 97 and 87 respectively, whereas only 12 infants’ deaths are recorded for the Americans.
Word count - 251 / Band score - 8
Task Achievement - The answer provides a paraphrased question, to begin with, followed by an overview that gives the reader key information.
Coherence and Cohesion - The answer has been divided into clear logical paragraphs.
Lexical Resource - There is evidence of paraphrasing, synonyms and some less common words.
Grammatical Range and Accuracy - The answer has no grammatical errors. The sentences are mainly made up of multiple clauses and have a variety of structures.
We hope you found this post helpful in helping you to study for the IELTS Test. Let us know in the comments or on the Facebook page if you have any questions. The best way to keep up to date with posts like this is to like us on Facebook, and then follow us onInstagramand Pinterest. We offer essay correction services, mock exams, and online courses. If you need help preparing for the IELTS Test, join the IELTS Achieve Academy and see how we can help you achieve your desired band score faster.
Step-by-step guide to answering this type of IELTS Writing Task 1 question. Covers structure, key language, and band-scoring criteria.
Originally published June 2017. Last reviewed 3 July 2026.
In this post, we will look at flowcharts, notes, tables, summaries and diagrams. It is very important that you will be able to >>
Understand information in flowcharts, diagrams and tables. These are used to give specific information for a fast analysis. In the test, you may have a table that you have to fill in, after finding the required information in an article.
Summaries and notes, a summary is a short review of something, you will often see this when looking for information about a book or movie, they will give you a short summary of what it is about. Notes can be in bullet form, with groups of words or single words, linked to a subject heading.
Read The Questions / Instructions
Before you start to read the information presented to you, first you must read the questions/instructions and think about the amount and type of information you can enter. If your answer does not follow the instructions given, then it will be marked as incorrect.
For example, you may be asked to;
Write no more than one word for each answer
Write no more than one word and/or a number for each answer
Write no more than two words for each answer
Write no more than three words for each answer
Finding Words In The Text
When reading information in a text you will be looking for specific information, that you can write onto a diagram, table or flowchart. This means you will use words that are in the text, paying close attention to the spelling. It is ok to copy words straight from the text, other forms of the word will be marked incorrect.
Read through the questions and skim read the text, can you answer the questions?
Dementia is a syndrome – usually of a chronic or progressive nature – in which there is deterioration in cognitive function (i.e. the ability to process thought) beyond what might be expected from normal ageing. It affects memory, thinking, orientation, comprehension, calculation, learning capacity, language, and judgement. Consciousness is not affected. The impairment in cognitive function is commonly accompanied, and occasionally preceded, by deterioration in emotional control, social behaviour, or motivation.
Dementia is a .................... which is usually continuous and gradual.
It can affect many cognitive functions, including ...................................., ......................, or ......................
According to the notes, dementia sufferers ........................ is not damaged.
Dementia can affect the ability to remember, awareness, direction and ..................
Answers >> Are at the bottom of the page.
Flowcharts
A flowchart is a graphic that shows the events of a process, normally in sequence. In the IELTS test, the flowchart questions are similar to the notes questions, but with arrows to tell you the sequence. When you read through the given text, the information presented may not be in the order of the flowchart.
Take a look at the information below and see if you can find the one-word answers that are missing.....
Climate change
Over the last 50 years, human activities – particularly the burning of fossil fuels – have released sufficient quantities of carbon dioxide and other greenhouse gases to trap additional heat in the lower atmosphere and affect the global climate. In the last 130 years, the world has warmed by approximately 0.85oC. Each of the last 3 decades has been successively warmer than any preceding decade since 18501. Sea levels are rising, glaciers are melting and precipitation patterns are changing. Extreme weather events are becoming more intense and frequent.
Answers >> Are at the bottom of the page.
Diagrams
There are different types of diagrams that you may see, including labelling a plan, or a design. The other types could be something from the natural world or a technical drawing. You may also see a diagram, for example, to read a text about the human body and then label parts of the body, using one-word (or more) answers from the text.
You may have a diagram that requires labelling from a selection of words in a box, try to understand what is happening in the diagram and where those words would fit. On the other hand, you may have a diagram that relates to a text you have to read and locate information relating to the diagram. Make sure you check how many words you need to write in the spaces, as writing too many will lose marks. Start with the most obvious and move on, if you are finding information in a text, read through quickly and don't waste time trying to read the whole text and understand it.
The information you will see in a table can be looked at quickly, by looking at the headings and the information in each row. The tables present information, for example, a timetable, exam results or in this case below, IELTS band scores.
Look at the table above, and see if you can answer the following questions >>
What do you need to score in listening to get a band score of 7?
What do you need to score in Academic reading to get a band score of 8?
What do you need to score in General Reading for a band score of 6?
Answers >> Are at the bottom of the page.
Summaries
A summary is a brief explanation of the main points on a topic. You will use and see many summaries all of the time, from reading what a movie is about or a book, you summarise the story or events. When you see a summary of the reading test, quickly highlight or underline the keywords and think about paraphrasing.
Asthma is a major non-communicable disease characterised by recurrent attacks of breathlessness and wheezing, which vary in severity and frequency from person to person. Symptoms may occur several times in a day or week in affected individuals, and for some people become worse during physical activity or at night. During an asthma attack, the lining of the bronchial tubes swells, causing the airways to narrow and reducing the flow of air into and out of the lungs. Recurrent asthma symptoms frequently cause sleeplessness, daytime fatigue, reduced activity levels and school and work absenteeism. Asthma has a relatively low fatality rate compared to other chronic diseases.
Choose one word only for each answer.
The severity of Asthma varies in each person, some may have many ............. and others few.
Due to physical activities or in the evening, many sufferers say that they become................
When an attack happens, the air that flows into the lungs is restricted, with the ................ becoming smaller.
Asthma does not cause many deaths in comparison to other .................... illnesses.
Answers >> Are at the bottom of the page.
REVIEW AND STRATEGY
The flowcharts, notes, tables, summaries and diagrams are common in the IELTS Reading Test, therefore you should practice and develop a strategy for answering.
TIP >> Read the instructions before you start reading the text. Make sure you understand the question.
TIP >> Study the diagram/flowchart and see how many words you need to write. For summaries, notes and tables, skim read and get the main idea.
TIP >> Highlight any keywords or labels you can see, then match them up if you see anything that stands out to you.
TIP >> Choose your answers carefully, be attentive to synonyms and paraphrasing and check your spelling.
Answers From All Exercises >>
Notes Answers >>
syndrome
deterioration in emotional control, social behaviour or motivation.
consciousness
comprehension
Flowchart Answers >>
carbon dioxide
decades
extreme
Diagram Answers >>
7. Spinal Nerve
8. Spinal Cord
9. Vertebra
10. Spinal Cord
Table Answers >>
33-35
36-37
26-30
Summary Answers >>
symptoms
worse
airways
chronic
We hope you found this post useful in helping you to study for the IELTS Test. If you have any questions please let us know in the comments below or on the Facebook page.
The best way to keep up to date with posts like this is to like us on Facebook, and then follow us on Instagram and Pinterest.
If you need help preparing for the IELTS Test, join the IELTS Achieve Academy and see how we can assist you to achieve your desired band score. We offer an essay correction service, mock exams, and online courses.