Step-by-step guide to answering this type of IELTS Writing Task 1 question. Covers structure, key language, and band-scoring criteria.
Originally published May 2018. Last reviewed 3 July 2026.
In this post, we will look at a Writing Task 1 Academic line graph essay example from the IELTS writing task 1 Academic Test. Students often ask if the questions are repeated year after year and the answer is no, but the type of chart or graph can be.
There are so many questions written each year, you may find you practice answering various questions on different topics. It is best practice to learn how to answer each one of the various types of writing task 1 questions, from bar charts, line graphs, maps, process etc.
If you would like to learn how to structure a charts and graphs essay please click the button below >
Take a look at the IELTS Writing Task 1 Academic essay example below >>
*This line graph question and answer were provided by a student. IELTS Achieve did not design this question*
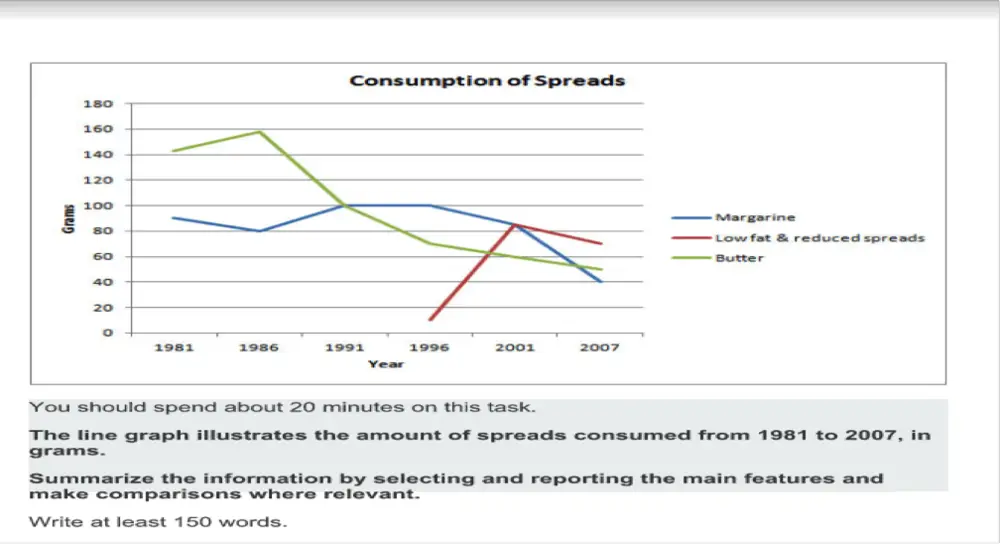
The graph gives information about the number of spreads (Margarine, low fat & reduced spread and butter) consumed from the year 1981 up to 2007. The units were measured in grams.
Overall, the highest consumed spread was butter which started as the most used among the three, whereas low fat and reduced spread were only introduced in 1996, however, all three spreads fluctuated within the end of the given time frame.
On the one hand, butter started strong with 140 grams consumed in the year 1981 but gradually decreased as the years progressed until it plummeted to nearly 50 grams used by 2007. Similarly, this can be seen in margarine with almost 90 grams used in 1981 then it slowly decreased in 1986. It reached a plateau in 1991 up to 1996 and gradually decreased reaching 40 grams used in 2007.
On the other hand, low fat & reduced spread was introduced in 1996. It gently rose from almost 10 grams used when it started then progressively increased reaching its highest peak in 2001 (80 grams) however like the two other spreads it slowly decreased up until 2007 were it garnered almost 60 grams.
Word count – 194 / Band score – 8
Task Achievement – The answer provides a paraphrased question, to begin with, followed by an overview that gives the reader key information.
Coherence and Cohesion – The answer has been divided into clear logical paragraphs.
Lexical Resource – There is evidence of paraphrasing, synonyms and some less common words.
Grammatical Range and Accuracy – The answer has no grammatical errors. The sentences are mainly made up of multiple clauses and have a variety of structures.
We hope you found this post helpful in helping you to study for the IELTS Test. Let us know in the comments or on the Facebook page if you have any questions. The best way to keep up to date with posts like this is to like us on Facebook, and then follow us onInstagramand Pinterest. We offer essay correction services, mock exams, and online courses. If you need help preparing for the IELTS Test, join the IELTS Achieve Academy and see how we can help you achieve your desired band score faster.
Step-by-step guide to answering this type of IELTS Writing Task 1 question. Covers structure, key language, and band-scoring criteria.
Originally published May 2018. Last reviewed 3 July 2026.
In this post, we will look at a Writing Task 1 Academic line graph essay example from the IELTS writing task 1 Academic Test. Students often ask if the questions are repeated year after year and the answer is no, but the type of chart or graph can be.
There are so many questions written each year, you may find you practice answering various questions on different topics. It is best practice to learn how to answer each one of the various types of writing task 1 questions, from bar charts, line graphs, maps, process etc.
If you would like to learn how to structure a charts and graphs essay please click the button below >
Take a look at the IELTS Writing Task 1 Academic essay example below >>
*This line graph question and answer were provided by a student. IELTS Achieve did not design this question*
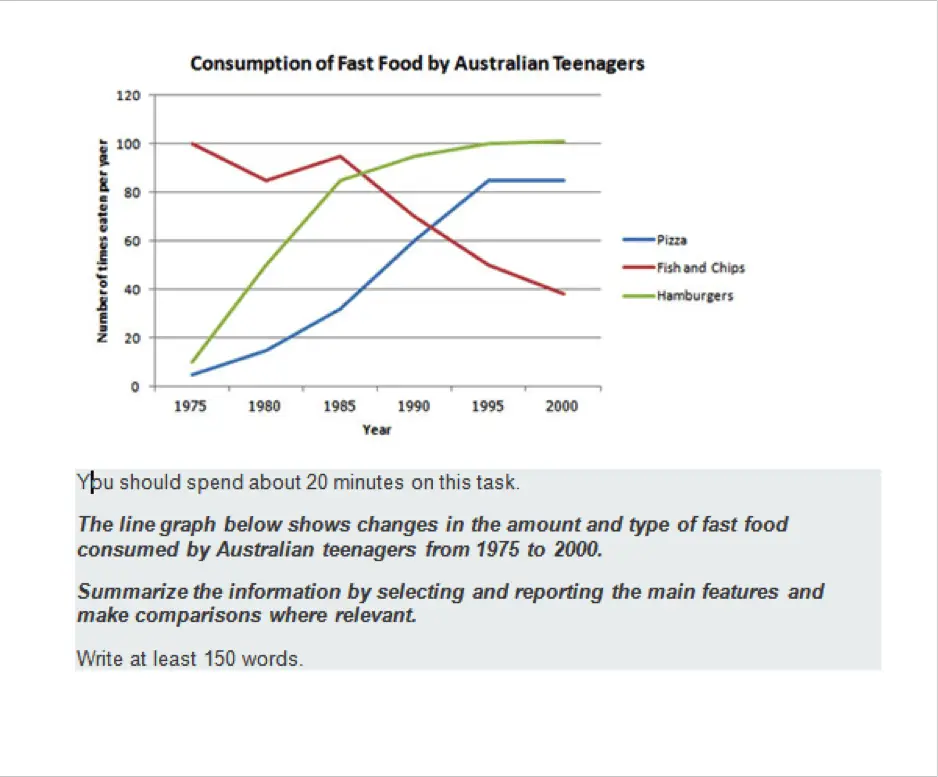
The line graph displays three varieties of fast foods (Hamburger, pizza and fish and chips) purchased by Australian teens over a 25-year period.
Overall, both pizza and hamburger consumption rose steadily as the years progressed until it remained steady by the year 2000, while fish and chips started strong at the beginning of the time period, then gradually plummeted reaching its lowest point at the end of 2000.
On the one hand, Australian teenagers didn’t opt to eat pizzas in 1975, as below 10 instances were recorded, however, as the years passed by, an upward trend can be observed in the number of pizzas consumed by Australian youths, as it reached its highest peak in 2000 at over 80 times per year. Similarly, the same can be said for eating hamburgers, below 20 hamburgers were consumed in 1975, this steadily increased until it reached its maximum peak at 100 hamburgers consumed per year by the year 2000.
On the other hand, fish and chips started out as being very popular. An average of a whopping 100 fish and chips were eaten in 1975 though it slightly decreased in 1980 (almost 80 times) then slowly rose again after 5 years ( 1985, 90 times) nonetheless it continued to decrease as the years passed by wherein the year 2000 it plummeted and reached its lowest peak at nearly 40 fish and chips.
Word count – 231 / Band score – 8
Task Achievement – The answer provides a paraphrased question, to begin with, followed by an overview that gives the reader key information.
Coherence and Cohesion – The answer has been divided into clear logical paragraphs.
Lexical Resource – There is evidence of paraphrasing, synonyms and some less common words.
Grammatical Range and Accuracy – The answer has no grammatical errors. The sentences are mainly made up of multiple clauses and have a variety of structures.
We hope you found this post helpful in helping you to study for the IELTS Test. Let us know in the comments or on the Facebook page if you have any questions. The best way to keep up to date with posts like this is to like us on Facebook, and then follow us onInstagramand Pinterest. We offer essay correction services, mock exams, and online courses. If you need help preparing for the IELTS Test, join the IELTS Achieve Academy and see how we can help you achieve your desired band score faster.
Step-by-step guide to answering this type of IELTS Writing Task 1 question. Covers structure, key language, and band-scoring criteria.
Originally published May 2018. Last reviewed 3 July 2026.
In this post, we will look at a Writing Task 1 Academic bar chart essay example from the IELTS writing task 1 Academic Test. Students often ask if the questions are repeated year after year and the answer is no, but the type of chart or graph can be.
There are so many questions written each year, you may find you practice answering various questions on different topics. It is best practice to learn how to answer each one of the various types of writing task 1 questions, from bar charts, line graphs, maps, process etc.
If you would like to learn how to structure a charts and graphs essay please click the button below >
Take a look at the IELTS Writing Task 1 Academic essay example below >>
*This chart question and answer were provided by a student. IELTS Achieve did not design this bar chart question*
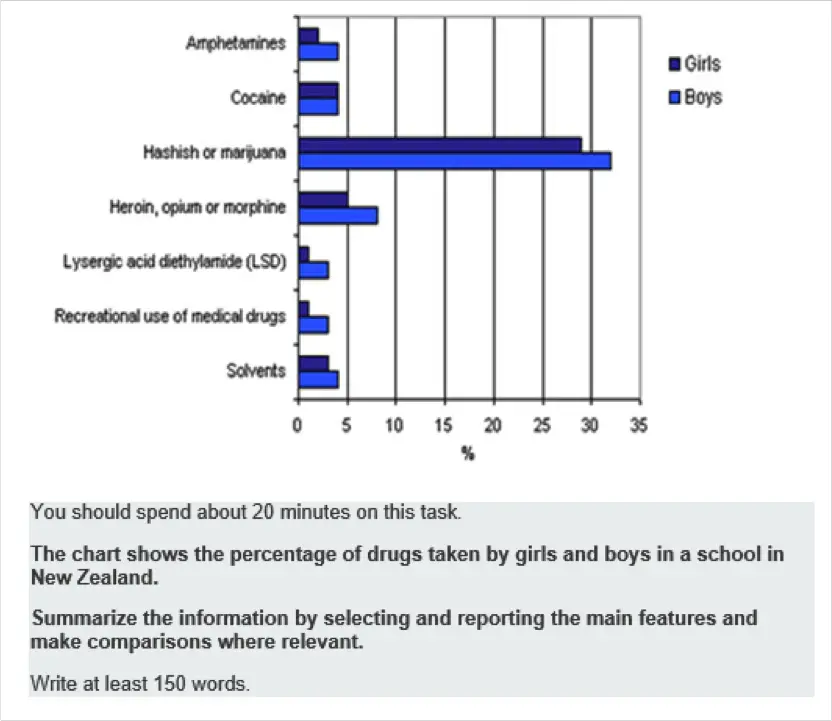
The bar chart illustrates the comparative statistics of seven addictive medicines used by male and female students in New Zealand. The units of measurement are in percentage.
Overall, marijuana or hashish claimed the top spot from both genders whereas lysergic acid diethylamide (LSD) and recreational use of medical drugs shared the lowest percentage of both male and female students.
On the one hand, marijuana or hashish received the highest percentage of both the female students (with nearly 30%) and from the male students (with almost 32%). Lesser used drugs are heroin, opium and morphine with 5% of the girls and closely 9% of the boys.
On the other hand, almost 5 % of the males and 4.5% of the females used solvents whereas both genders preferred to use cocaine which was equally tied at 4%. Amphetamines were also included on the list, with 3% from the girls and almost 5% from the boys.
Finally, lysergic acid diethylamide and the use of recreational drugs tied at the lowest spot with only 2% from the female students and around 3.5% from the male students.
Word count – 182 / Band score 8
Task Achievement – The answer provides a paraphrased question, to begin with, followed by an overview that gives the reader key information.
Coherence and Cohesion – The answer has been divided into clear logical paragraphs.
Lexical Resource – There is evidence of paraphrasing, synonyms and some less common words.
Grammatical Range and Accuracy – The answer has no grammatical errors. The sentences are mainly made up of multiple clauses and have a variety of structures.
We hope you found this post helpful in helping you to study for the IELTS Test. Let us know in the comments or on the Facebook page if you have any questions. The best way to keep up to date with posts like this is to like us on Facebook, and then follow us onInstagramand Pinterest. We offer essay correction services, mock exams, and online courses. If you need help preparing for the IELTS Test, join the IELTS Achieve Academy and see how we can help you achieve your desired band score faster.
Step-by-step guide to answering this type of IELTS Writing Task 1 question. Covers structure, key language, and band-scoring criteria.
Originally published May 2018. Last reviewed 3 July 2026.
In this post, we will look at a Writing Task 1 Academic bar chart essay example from the IELTS writing task 1 Academic Test. Students often ask if the questions are repeated year after year and the answer is no, but the type of chart or graph can be.
There are so many questions written each year, you may find you practice answering various questions on different topics. It is best practice to learn how to answer each one of the various types of writing task 1 questions, from bar charts, line graphs, maps, process etc.
If you would like to learn how to structure a charts and graphs essay please click the button below >
Take a look at the IELTS Writing Task 1 Academic essay example below >>
*This chart question and answer were provided by a student. IELTS Achieve did not design this bar chart question*
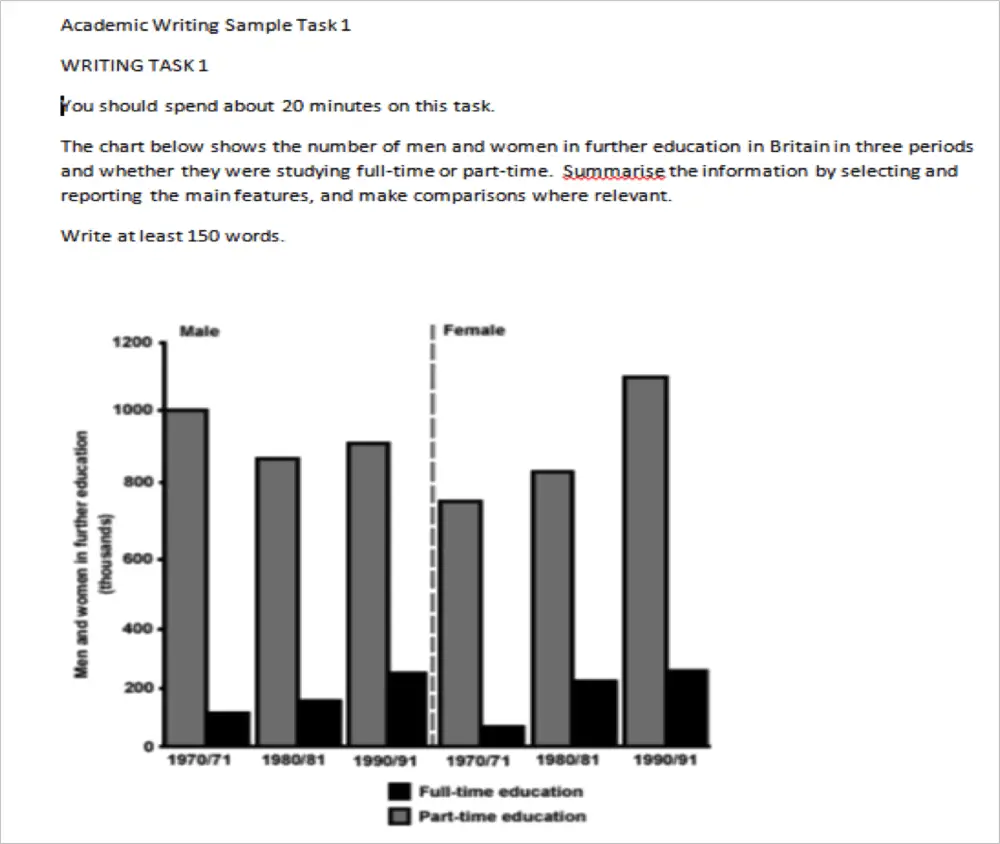
The bar chart illustrates comparative statistics on the number of males and females who underwent further education, studying in full time and in part-time education in Britain in the years; 1970-1971, 1980-1981 and 1990-1991. The number of students was measured in thousands.
Overall, part-time education had the highest number of enrollees in all three periods from both men and women while in full-time education, the highest number of students can be seen in the time period of 1990-1991 where both sexes had an equal amount of enrollees.
On the one hand, the graph shows that part-time education was consistently high, never below the 800 thousand mark in males and 600 thousand marks in females, even though the trend differs from both genders. According to the data, males had the highest part-time enrollees in 1970-1971 (1000 thousand) then the trend fluctuated and rose again over the next three year period 1980-81 (900 thousand) and 1990-91 (950 thousand), while in the female part-time enrollees they had an upward trend as the years went by with 750 thousand in 1970-71, 800 thousand students in 1980-81 and the highest peak of almost 1150 thousand students by the period of 1990-91.
On the other hand, the bar chart reveals that both genders in full-time education experienced an increasing number of students within the three time periods. Male students started at below 200 thousand in 1970-71 and rose steadily until they reached 200 thousand in 1990-91, the same can be said in the number of females enrolled, they started from 50 thousand in 1970-1971 and gradually rose as the years passed by until reaching 200 thousand female students in 1990-1991.
Word count – 274 / Band score – 8
Task Achievement – The answer provides a paraphrased question, to begin with, followed by an overview that gives the reader key information.
Coherence and Cohesion – The answer has been divided into clear logical paragraphs.
Lexical Resource – There is evidence of paraphrasing, synonyms and some less common words.
Grammatical Range and Accuracy – The answer has no grammatical errors. The sentences are mainly made up of multiple clauses and have a variety of structures.
We hope you found this post helpful in helping you to study for the IELTS Test. Let us know in the comments or on the Facebook page if you have any questions. The best way to keep up to date with posts like this is to like us on Facebook, and then follow us onInstagramand Pinterest. We offer essay correction services, mock exams, and online courses. If you need help preparing for the IELTS Test, join the IELTS Achieve Academy and see how we can help you achieve your desired band score faster.
Step-by-step guide to answering this type of IELTS Writing Task 1 question. Covers structure, key language, and band-scoring criteria.
Originally published May 2018. Last reviewed 3 July 2026.
In this post, we will look at a Writing Task 1 Academic bar chart essay example from the IELTS writing task 1 Academic Test. Students often ask if the questions are repeated year after year and the answer is no, but the type of chart or graph can be.
There are so many questions written each year, you may find you practice answering various questions on different topics. It is best practice to learn how to answer each one of the various types of writing task 1 questions, from bar charts, line graphs, maps, process etc.
If you would like to learn how to structure a charts and graphs essay please click the button below >
Take a look at the IELTS Writing Task 1 Academic essay example below >>
*This chart question and answer were provided by a student. IELTS Achieve did not design this bar chart question*
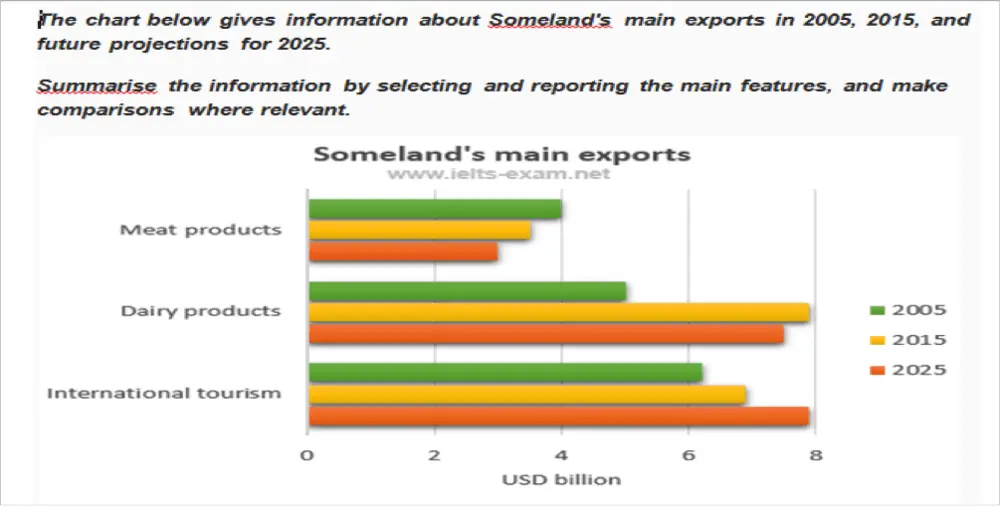
The bar chart describes comparative statistics on the number of products exported by Someland in 2005 and 2015 and its projected exports for 2025. The units were measured in USD billion.
Overall, the most profitable export Someland had from 2005 and 2015 was from international tourism, while the lowest can be seen in meat produce. It can also be seen in the data that by 2025 they are still expecting that international travels will dominate the Someland export industry whereas meat produce will still bring in the least amount of revenue.
On the one hand, the graph shows that International tourism was consistently high, with nearly 6.5 billion USD earned in 2005 and almost 7 billion USD in 2015. Similarly, this can be said in dairy products where roughly 5 million USD and approximately 8 million USD was grossed in 2005 and 2015 respectively. Meat products started at 4 million USD dollars in 2005 but decreased after 10 years (3.5 million USD, 2015).
On the other hand, a projected study was also included in the data, where they are expecting an increase by 2025 in International tourism which could receive 8 million USD, while decreases in both dairy products (7.5 billion USD) and meat products (3 billion USD) are also expected.
Word count – 211 / Band Score 8
Task Achievement – The answer provides a paraphrased question, to begin with, followed by an overview that gives the reader key information.
Coherence and Cohesion – The answer has been divided into clear logical paragraphs.
Lexical Resource – There is evidence of paraphrasing, synonyms and some less common words.
Grammatical Range and Accuracy – The answer has no grammatical errors. The sentences are mainly made up of multiple clauses and have a variety of structures.
We hope you found this post helpful in helping you to study for the IELTS Test. Let us know in the comments or on the Facebook page if you have any questions. The best way to keep up to date with posts like this is to like us on Facebook, and then follow us onInstagramand Pinterest. We offer essay correction services, mock exams, and online courses. If you need help preparing for the IELTS Test, join the IELTS Achieve Academy and see how we can help you achieve your desired band score faster.
Take a look at the IELTS Direct Question Essay example below:
If you would like to purchase a 29 page PDF download that is easy to read and print out please take a look at the bookshop >
Education and Teaching
Fewer and fewer young people are choosing to become a teacher. Why do young people do not want to become teachers? How this could be changed?
Take a look at the model answer.
The number of college graduates who want to become professors is declining rapidly as the year’s progress. Firstly, this essay believes that students do not choose to become teachers because they think that this profession is not a high paying job and secondly, it will discuss possible solutions that could make teaching an attractive vocation. On the one hand, becoming a teacher is a very challenging career path. This is demanding work for they need a lot of patience and dedication in order to teach different kinds of personalities. In addition, the salary of a teacher is not enough to cover the costs of more than a one-person family and in order to make extra income, many teachers have second jobs. For instance, a study by the National Teachers Coalition in the Philippines in 2014 reported that 70% of secondary teachers in public schools in Metro Manila offered private study lessons outside of their school hours. On the other hand, the government should offer free scholarship grants for those students who want to pursue becoming a teacher. This could encourage them to choose the teaching profession for this would allow them to develop a career with many possibilities, once trained. The government could also raise the teaching salary to match other schools based in other countries. For example, a survey by the Department of Education in the Philippines in 2011 revealed that 6 out of 10 students chose to become a teacher after gaining a full scholarship program, with the understanding that they have to teach in their country for at least 2 years. In conclusion, to become a teacher is a noble profession. The government should compensate them for their tasks in helping future minds reach their potential. They need to offer support so that the teaching profession can continue to grow and develop.
(Word count – 306 / Band score 8)
The following video will give you contains sample Essay in audiovisual format.
Instructor Feedback on IELTS Direct Question Essay: Education and Teaching
Task Achievement – The essay provides an answer to the question asked, supported by relevant examples.
Coherence and Cohesion – The answer has been divided into clear logical paragraphs and each main body paragraph only has one main idea. There are cohesive links between the main body paragraphs.
Lexical Resource – There is evidence of a wide range of vocabulary, with no errors in the text.
Grammatical Range and Accuracy – The answer has no grammatical errors. The sentences have a wide range of structures.
We hope you found this post helpful in helping you to study for the IELTS Test. Let us know in the comments or on the Facebook page if you have any questions. The best way to keep up to date with posts like this is to like us on Facebook, and then follow us onInstagramand Pinterest. We offer essay correction services, mock exams, and online courses. If you need help preparing for the IELTS Test, join the IELTS Achieve Academy and see how we can help you achieve your desired band score faster.