IELTS Writing Task 1 Academic table essay example that is a band score 8. The question is: The table below gives information about the problems faced by children in two primary schools in 2005 and 2015. Take a look at the sample answer
IELTS Writing Task 1 Academic table essay example that is a band score 8. The question is : The table illustrates the proportion of monthly household income five European countries spend on food and drink, housing, clothing, and entertainment. Take a look at the sample answer.
IELTS Writing Task 1 Academic table essay example that is a band score 8. The question is: The following table gives statistics showing the aspects of quality of life in five countries. Take a look at the sample answer.
IELTS Writing Task 1 Academic pie chart essay example that is a band score 8. The question is: The chart below shows how much money is spent in the budget on different sectors by the UAE government in 2000. Take a look at the sample answer.
IELTS Writing Task 1 Academic line graph essay example that is a band score 8. The question is: The line graph illustrates the amount of spreads consumed from 1981 to 2007, in grams. Take a look at the sample answer.
IELTS Writing Task 1 Academic line graph essay example that is a band score 8. The question is: The line graph below shows changes in the amount and type of fast food consumed by Australian teenagers from 1975 to 2000. Take a look at the sample answer.
IELTS Writing Task 1 Academic bar chart essay example that is a band score 8. The question is: The chart shows the percentage of drugs taken by girls and boys in a school in New Zealand. Take a look at the sample answer.
IELTS Writing Task 1 Academic bar chart essay example that is a band score 8. The question is: The chart below shows the number of men and women in further education in Britain in three periods and whether they were studying full time or part-time. Take a look at the sample answer.
IELTS Writing Task 1 Academic bar chart essay example that is a band score 8. The question is: The chart below gives information about Someland’s main exports in 2005, 2015, and future projections for 2025. Take a look at the sample answer.
Step-by-step guide to answering this type of IELTS Writing Task 1 question. Covers structure, key language, and band-scoring criteria.
Originally published May 2018. Last reviewed 3 July 2026.
In this post, we will look at a Writing Task 1 Academic bar chart essay example from the IELTS writing task 1 Academic Test. Students often ask if the questions are repeated year after year and the answer is no, but the type of chart or graph can be.
There are so many questions written each year, you may find you practice answering various questions on different topics. It is best practice to learn how to answer each one of the various types of writing task 1 questions, from bar charts, line graphs, maps, process etc.
If you would like to learn how to structure a charts and graphs essay please click the button below >
Take a look at the IELTS Writing Task 1 Academic essay example below >>
*This chart question and answer were provided by a student. IELTS Achieve did not design this bar chart question*
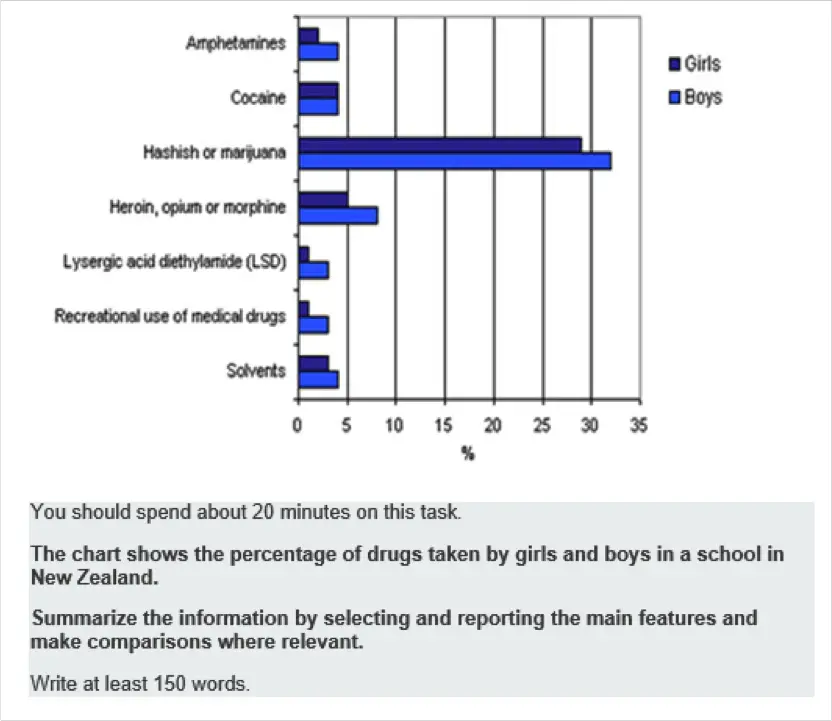
The bar chart illustrates the comparative statistics of seven addictive medicines used by male and female students in New Zealand. The units of measurement are in percentage.
Overall, marijuana or hashish claimed the top spot from both genders whereas lysergic acid diethylamide (LSD) and recreational use of medical drugs shared the lowest percentage of both male and female students.
On the one hand, marijuana or hashish received the highest percentage of both the female students (with nearly 30%) and from the male students (with almost 32%). Lesser used drugs are heroin, opium and morphine with 5% of the girls and closely 9% of the boys.
On the other hand, almost 5 % of the males and 4.5% of the females used solvents whereas both genders preferred to use cocaine which was equally tied at 4%. Amphetamines were also included on the list, with 3% from the girls and almost 5% from the boys.
Finally, lysergic acid diethylamide and the use of recreational drugs tied at the lowest spot with only 2% from the female students and around 3.5% from the male students.
Word count - 182 / Band score 8
Task Achievement - The answer provides a paraphrased question, to begin with, followed by an overview that gives the reader key information.
Coherence and Cohesion - The answer has been divided into clear logical paragraphs.
Lexical Resource - There is evidence of paraphrasing, synonyms and some less common words.
Grammatical Range and Accuracy - The answer has no grammatical errors. The sentences are mainly made up of multiple clauses and have a variety of structures.
We hope you found this post helpful in helping you to study for the IELTS Test. Let us know in the comments or on the Facebook page if you have any questions. The best way to keep up to date with posts like this is to like us on Facebook, and then follow us onInstagramand Pinterest. We offer essay correction services, mock exams, and online courses. If you need help preparing for the IELTS Test, join the IELTS Achieve Academy and see how we can help you achieve your desired band score faster.
Step-by-step guide to answering this type of IELTS Writing Task 1 question. Covers structure, key language, and band-scoring criteria.
Originally published May 2018. Last reviewed 3 July 2026.
In this post, we will look at a Writing Task 1 Academic bar chart essay example from the IELTS writing task 1 Academic Test. Students often ask if the questions are repeated year after year and the answer is no, but the type of chart or graph can be.
There are so many questions written each year, you may find you practice answering various questions on different topics. It is best practice to learn how to answer each one of the various types of writing task 1 questions, from bar charts, line graphs, maps, process etc.
If you would like to learn how to structure a charts and graphs essay please click the button below >
Take a look at the IELTS Writing Task 1 Academic essay example below >>
*This chart question and answer were provided by a student. IELTS Achieve did not design this bar chart question*
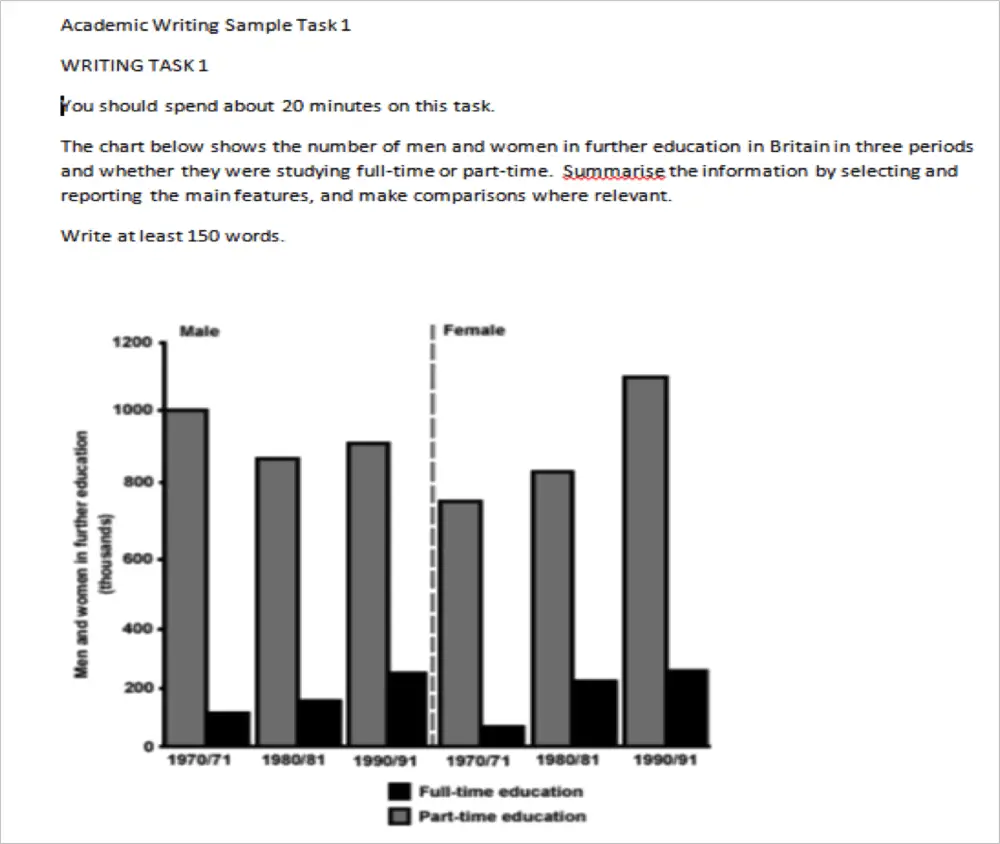
The bar chart illustrates comparative statistics on the number of males and females who underwent further education, studying in full time and in part-time education in Britain in the years; 1970-1971, 1980-1981 and 1990-1991. The number of students was measured in thousands.
Overall, part-time education had the highest number of enrollees in all three periods from both men and women while in full-time education, the highest number of students can be seen in the time period of 1990-1991 where both sexes had an equal amount of enrollees.
On the one hand, the graph shows that part-time education was consistently high, never below the 800 thousand mark in males and 600 thousand marks in females, even though the trend differs from both genders. According to the data, males had the highest part-time enrollees in 1970-1971 (1000 thousand) then the trend fluctuated and rose again over the next three year period 1980-81 (900 thousand) and 1990-91 (950 thousand), while in the female part-time enrollees they had an upward trend as the years went by with 750 thousand in 1970-71, 800 thousand students in 1980-81 and the highest peak of almost 1150 thousand students by the period of 1990-91.
On the other hand, the bar chart reveals that both genders in full-time education experienced an increasing number of students within the three time periods. Male students started at below 200 thousand in 1970-71 and rose steadily until they reached 200 thousand in 1990-91, the same can be said in the number of females enrolled, they started from 50 thousand in 1970-1971 and gradually rose as the years passed by until reaching 200 thousand female students in 1990-1991.
Word count - 274 / Band score - 8
Task Achievement - The answer provides a paraphrased question, to begin with, followed by an overview that gives the reader key information.
Coherence and Cohesion - The answer has been divided into clear logical paragraphs.
Lexical Resource - There is evidence of paraphrasing, synonyms and some less common words.
Grammatical Range and Accuracy - The answer has no grammatical errors. The sentences are mainly made up of multiple clauses and have a variety of structures.
We hope you found this post helpful in helping you to study for the IELTS Test. Let us know in the comments or on the Facebook page if you have any questions. The best way to keep up to date with posts like this is to like us on Facebook, and then follow us onInstagramand Pinterest. We offer essay correction services, mock exams, and online courses. If you need help preparing for the IELTS Test, join the IELTS Achieve Academy and see how we can help you achieve your desired band score faster.
Step-by-step guide to answering this type of IELTS Writing Task 1 question. Covers structure, key language, and band-scoring criteria.
Originally published May 2018. Last reviewed 3 July 2026.
In this post, we will look at a Writing Task 1 Academic bar chart essay example from the IELTS writing task 1 Academic Test. Students often ask if the questions are repeated year after year and the answer is no, but the type of chart or graph can be.
There are so many questions written each year, you may find you practice answering various questions on different topics. It is best practice to learn how to answer each one of the various types of writing task 1 questions, from bar charts, line graphs, maps, process etc.
If you would like to learn how to structure a charts and graphs essay please click the button below >
Take a look at the IELTS Writing Task 1 Academic essay example below >>
*This chart question and answer were provided by a student. IELTS Achieve did not design this bar chart question*
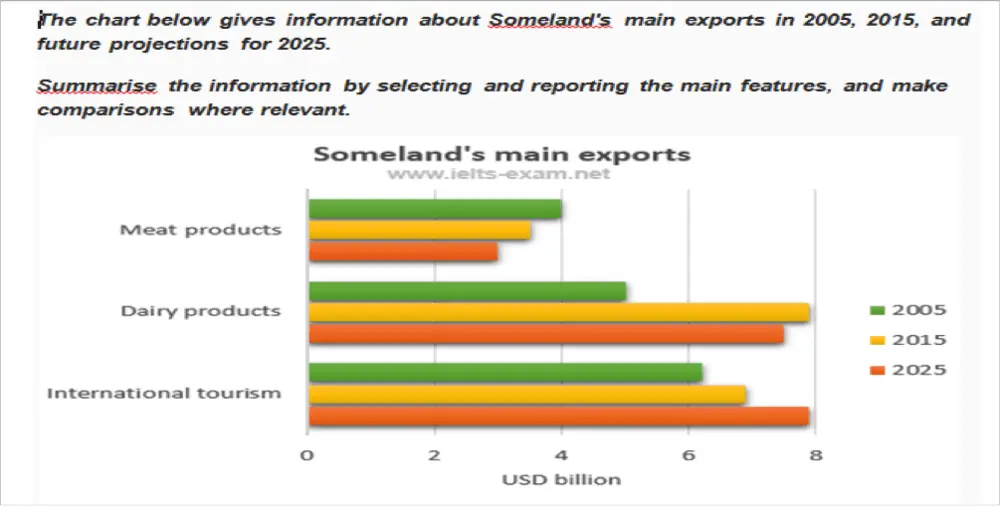
The bar chart describes comparative statistics on the number of products exported by Someland in 2005 and 2015 and its projected exports for 2025. The units were measured in USD billion.
Overall, the most profitable export Someland had from 2005 and 2015 was from international tourism, while the lowest can be seen in meat produce. It can also be seen in the data that by 2025 they are still expecting that international travels will dominate the Someland export industry whereas meat produce will still bring in the least amount of revenue.
On the one hand, the graph shows that International tourism was consistently high, with nearly 6.5 billion USD earned in 2005 and almost 7 billion USD in 2015. Similarly, this can be said in dairy products where roughly 5 million USD and approximately 8 million USD was grossed in 2005 and 2015 respectively. Meat products started at 4 million USD dollars in 2005 but decreased after 10 years (3.5 million USD, 2015).
On the other hand, a projected study was also included in the data, where they are expecting an increase by 2025 in International tourism which could receive 8 million USD, while decreases in both dairy products (7.5 billion USD) and meat products (3 billion USD) are also expected.
Word count - 211 / Band Score 8
Task Achievement - The answer provides a paraphrased question, to begin with, followed by an overview that gives the reader key information.
Coherence and Cohesion - The answer has been divided into clear logical paragraphs.
Lexical Resource - There is evidence of paraphrasing, synonyms and some less common words.
Grammatical Range and Accuracy - The answer has no grammatical errors. The sentences are mainly made up of multiple clauses and have a variety of structures.
We hope you found this post helpful in helping you to study for the IELTS Test. Let us know in the comments or on the Facebook page if you have any questions. The best way to keep up to date with posts like this is to like us on Facebook, and then follow us onInstagramand Pinterest. We offer essay correction services, mock exams, and online courses. If you need help preparing for the IELTS Test, join the IELTS Achieve Academy and see how we can help you achieve your desired band score faster.
Step-by-step guide to answering this type of IELTS Writing Task 1 question. Covers structure, key language, and band-scoring criteria.
Originally published May 2017. Last reviewed 3 July 2026.
This post will help you to write a successful bar chart essay, there is a model answer for you to compare your work to at the end of the post.
Remember that your essay should have a minimum of 150 words and ideally should be completed in 20 minutes.
THE WRITING TASK 1 ESSAY STRUCTURE:
Writing task 1 Question
Read the question below carefully, what can you see in the information given?
STEP 1 - WRITE THE INTRODUCTION
Write your own introduction of one or two sentences, paraphrasing the question, using synonyms where you can.
STEP 2 - WRITE AN OVERVIEW
Write the overview - start this paragraph with the word 'Overall...' and write one or two sentences that describe the main features of the information presented in the bar chart.
STEP 3 - WRITE THE MAIN BODY PARAGRAPHS
Write two main body paragraphs, going into detail and giving specific information about the chart. Remember to include data to support your findings. For example, look for the highs and lows and any major increases or decreases over time.
STEP 4 - CHECK YOUR WORK
When you have completed the essay, check it for any errors, spelling or grammar. Then check to see if you have included linking words that connect the information together, making it easy to read. For example, using the word 'Overall..' at the beginning of the overview paragraph. You can also use words like - on the one hand, on the other hand, furthermore, however, in addition, finally etc.
MODEL ANSWER
To view the model answer for this question please click the button below >>
We hope you found this post useful in helping you to study for the IELTS Test. If you have any questions please let us know in the comments below or on the Facebook page.
The best way to keep up to date with posts like this is to like us on Facebook, then follow us on Instagram and Pinterest.
If you need help preparing for the IELTS Test, join the IELTS Achieve Academy and see how we can assist you to achieve your desired band score. We offer an essay correction service, mock exams and online courses.
How to Describe Process Diagrams
Process diagrams show the stages involved in making something, or how a natural or mechanical process works. Unlike other Task 1 questions, process diagrams require you to describe a sequence rather than compare data.
Essential Process Vocabulary
Stage
Language
Beginning
The process begins with…, The first stage involves…, Initially…
Sequence
Following this…, Subsequently…, After that…, The next step is…
Simultaneous
At the same time…, Meanwhile…, Concurrently…
Result
This results in…, This produces…, As a result…
Final stage
Finally…, In the last stage…, The process concludes when…
Structure Guide
Introduction: Paraphrase what the diagram shows (e.g., "The diagram illustrates the process by which cement is manufactured").
Overview: State how many stages there are and whether the process is linear or cyclical.
Body paragraphs: Describe the stages in order, grouping related steps logically.
Tips for Band 7+
Use the passive voice throughout (e.g., "the materials are heated" not "someone heats the materials")
Include sequencing connectors to show the order clearly
Count the stages and mention the total in your overview
Do not speculate about reasons — only describe what the diagram shows
Originally published on IELTS Achieve. Last reviewed 3 July 2026.