Step-by-step guide to answering this type of IELTS Writing Task 1 question. Covers structure, key language, and band-scoring criteria.
Originally published May 2018. Last reviewed 3 July 2026.
In this post, we will look at a Writing Task 1 Academic multiple chart essay example Visits to and from the UK from the IELTS writing task 1 Academic Test.
Students often ask if the questions are repeated year after year and the answer is no, but the type of chart or graph can be. There are so many questions written each year, you may find you practice answering various questions on different topics. It is best practice to learn how to answer each one of the various types of writing task 1 questions, from bar charts, line graphs, maps, process etc.
If you would like to learn how to structure a multiple charts essay please click the button below:
Take a look at the IELTS Multiple Charts Essay example below:
*This multiple chart question and answer were provided by a student. IELTS Achieve did not design this question*
Visits to and from the UK
You should spend about 20 minutes on this task. The line graph shows visits to and from the UK from 1979 to 1999, and the bar graph shows the most popular countries visited by UK residents in 1999. Summarize the information by selecting and reporting the main features and make comparisons where relevant. Write at least 150 words.
Take a look at the model answer.
The line graph illustrates the comparative statistics on the number of people who visited the UK and the number of British citizens who went outside the country during a 20-year period whereas the bar chart gives detail about the top 5 well-liked countries visited by the British people. The units of measurement are in millions.
Overall, the number of people who visited the UK increased gradually over the years. Similarly, the same trend can be seen in the British people who went out of the country for a vacation. The data also gives information about France, which received the highest number of visiting Brits in the span of 20 years, whereas Turkey had the least number of visitors.
On the one hand, around 10 million visitors who went to the UK were recorded in 1979, it then reached a plateau in 1984 and gradually increased by almost double when it reached 1989. The trend kept on increasing in 1994 up until 1999 when it received 25 million guests and almost 30 million visitors respectively. The same can be concluded of the British people who travelled abroad, almost 11 million UK citizens left the country in 1979 and then it progressively increased up until 1999 where it reached its all-time high of nearly 54 million vacationers.
On the other hand, France ranked first among the five countries that are listed in the data wherein it garnered almost 11 million visitors in 1999. Spain and the USA followed with nearly 9 million visitors and almost 4 million guests respectively. The data also shows that Greece received close to 3.5 million visitors whereas only 3 million British citizens visited Turkey.
Word count – 277 / Band score 8
Instructor Feedback on IELTS Multiple Charts Essay: Visits to and from the UK
Task Achievement – The answer provides a paraphrased question, to begin with, followed by an overview that gives the reader key information.
Coherence and Cohesion – The answer has been divided into clear logical paragraphs.
Lexical Resource – There is evidence of paraphrasing, synonyms and some less common words.
Grammatical Range and Accuracy – The answer has no grammatical errors. The sentences are mainly made up of multiple clauses and have a variety of structures.
We hope you found this post helpful in helping you to study for the IELTS Test. Let us know in the comments or on the Facebook page if you have any questions. The best way to keep up to date with posts like this is to like us on Facebook, and then follow us onInstagramand Pinterest. We offer essay correction services, mock exams, and online courses. If you need help preparing for the IELTS Test, join the IELTS Achieve Academy and see how we can help you achieve your desired band score faster.
Step-by-step guide to answering this type of IELTS Writing Task 1 question. Covers structure, key language, and band-scoring criteria.
Originally published May 2017. Last reviewed 3 July 2026.
This lesson will help you to write a successful multiple charts essay, there is a model answer for you to compare your work to at the end of the post.
Remember that your essay should have a minimum of 150 words and ideally should be completed in 20 minutes.
Multiple charts essay structure
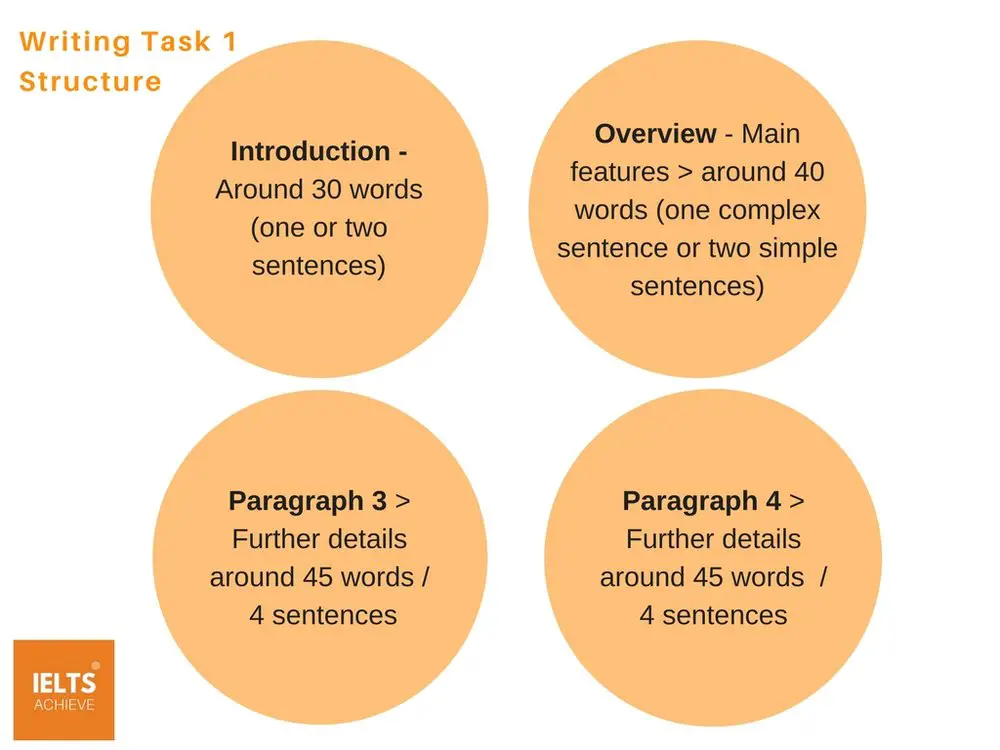
The writing task 1 essay should be as follows:
Multiple charts essay Question
Read the question below carefully, what can you see in the information given in the chart?
Step 1 – Write the introduction
Write your own introduction of one or two sentences, paraphrasing the question, using synonyms where you can.
STEP 2 – WRITE AN OVERVIEW
Write the overview – start this paragraph with the word ‘Overall...’ and write one or two sentences which describe the main features of the information presented in the charts.
Step 2 – Write an overview
Write two main body paragraphs, going into detail and giving specific information about the charts. Remember to include data to support your findings. For example, look for the highs and lows and any major increases or decreases over time. Can you make any comparisons?
STEP 4 – CHECK YOUR WORK
When you have completed the essay, check it for any errors, spelling or grammar. Then check to see if you have included linking words that connect the information together, making it easy to read. For example, using the word ‘Overall..’ at the beginning of the overview paragraph. You can also use words like – on the one hand, on the other hand, furthermore, however, in addition, finally etc.
MODEL ANSWER
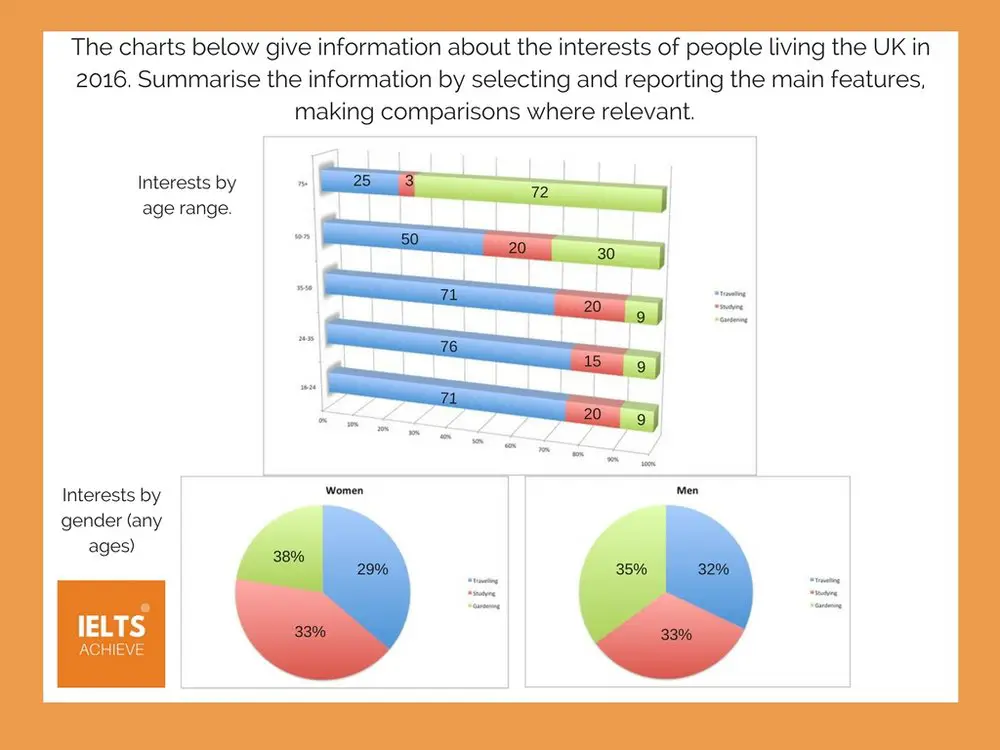
The charts both show relevant data about the interests, of people living in the UK in 2016. Moreover, the two charts represent males and females of all ages and their interests by gender, while the bar chart displays the exact level of interests according to the current age range from 16 to 75+ years. Overall, there is a common pattern in regards to the percentage of activities between both genders and it is evidenced that there are both women and men who enjoy studying and gardening. The bar chart shows that there are high numbers of young people aged 24-50 who are interested in travelling. On the one hand, there is a massive difference between the population who are 50-75 years old and the 75+ years regarding their interest in gardening (72%). However, the age groups with the most desire to travel in 2016 are those aged between 24-35 (76%). Furthermore, there are similar numbers of people who are interested in travelling between the age ranges of 16-24 to 35-50 (71%), which is currently expressed in the proportional bar chart. On the other hand, there is evidence of a smaller percentage of women (29%) who want to travel compared to men (32%). People of both genders who enjoy gardening, with a contrast of 38% for women and 35% for men. Finally, both males and females are equal in their passion for studying. (33%).
Step-by-step guide to answering this type of IELTS Writing Task 1 question. Covers structure, key language, and band-scoring criteria.
Originally published May 2017. Last reviewed 3 July 2026.
A question on the IELTS academic writing test that is becoming more common, asks the candidate to write about more than one chart or diagram.
You may have a pie chart and a table, a bar chart and a line graph, or any combination of charts. In this post we will look at how to write this type of essay, with structure help, vocabulary and sample answers.
When writing your own introduction of one or two sentences paraphrase the question and add detail.
Paragraph 2 – Overview of the main features
You need to be able to give a broad summary of the information. This is best started with – Overall……. then giving details of the main features you can see. You can write this in one or two sentences, which describe the main features of the information that is presented in the charts. Think about the main features that you can see in chart number 1, and then write about the main features you can see in chart number 2. You should then make any comparisons if relevant.
Paragraph 3 – Specific details of the main features in chart number 1
Write about the specific details that you can see – looking closely at the main features of chart number 1 and include detail, then make any comparisons if relevant.
Paragraph 4 – Specific details of the main features in chart number 2
Write about the specific details that you can see – looking closely at the main features of chart number 2 and include detail, then make any comparisons if relevant.
Writing Task 1 Multiple Charts Sample Essays >>
Here are two sample essay questions and answers for you to look at. Review the language used, the essay structure, the information gathered and how it has been written.
Sample Multiple Chart Essay 1
The charts both show relevant data about the interests, of people living in the UK in 2016. Moreover, the two charts represent males and females of all ages and their interests by gender, while the bar chart displays the exact level of interests according to the current age range from 16 to 75+ years.
Overall, there is a common pattern in regards to the percentage of activities between both genders and it is evidenced that there are both women and men who enjoy studying and gardening. The bar chart shows that there are high numbers of young people aged 24-50 who are interested in travelling.
On the one hand, there is a massive difference between the population who are 50-75 years old and the 75+ years regarding their interest in gardening (72%). However, the age groups with the most desire to travel in 2016 are those aged between 24-35 (76%). Furthermore, there are similar numbers of people who are interested in travelling between the age ranges of 16-24 to 35-50 (71%), which is currently expressed in the proportional bar chart.
On the other hand, there is evidence of a smaller percentage of women (29%) who want to travel compared to men (32%). People of both genders who enjoy gardening, with a contrast of 38% for women and 35% for men. Finally, both males and females are equal in their passion for studying. (33%).
(Word Count = 233 / Band Score 9)
Task Achievement – The answer provides relevant information, summarising the interests by age range and then interests by gender. The main features are given and comparisons made, with the relevant information given.
Coherence and Cohesion – The answer has been divided into clear logical paragraphs, with clear cohesion between them with the addition of linking words (overall, on the one hand, on the other hand, finally, however, furthermore).
Lexical Resource – There is evidence of paraphrasing, synonyms and some less common words.
Grammatical Range and Accuracy – The answer has no grammatical errors. The sentences are mainly made up of multiple clauses and have a variety of structures. There are no spelling mistakes.
TIP >> Remember to compare the information given, but focus on one idea in each main body paragraph.
TIP >> Remember to include numbers / stats / data in the main body paragraphs. This may seem obvious but many students do not include this.
Sample Multiple Chart Essay 2
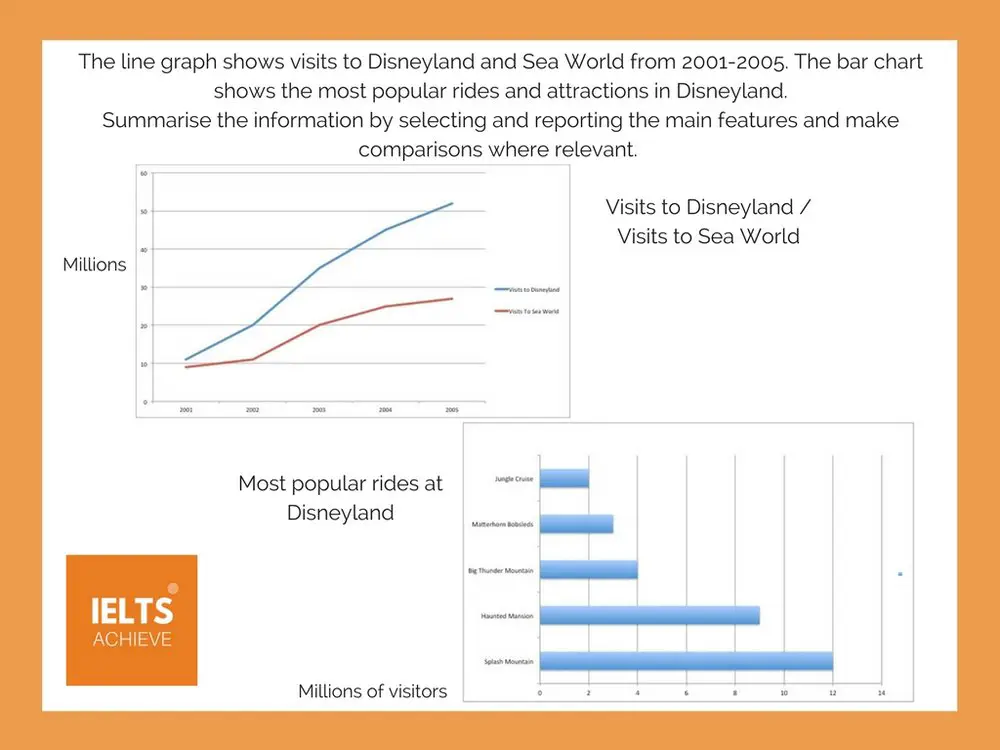
The line graph reflects the number of people who travelled to Disneyland and Sea World between 2001 and 2005, while the bar chart illustrates the most popular rides people visited at Disneyland. Units are measured in millions of people.
Overall, the line graph shows that there was an increase in the number of visits to Disneyland compared to Sea World in the period given. However, the bar chart shows that Splash Mountain was the most popular ride taken.
Initially, we can observe that in the year 2001 there are a small number of people who travelled to Sea World (9 million). This increased slowly during the following years to nearly 30 million people in 2005. The number of people who visited Disneyland was slightly higher (12 million). In 2003, around 20 million entered Disneyland, this progressed continuously, reaching to over 50 million people in 2005.
Furthermore, the second graph clearly shows that over 12 million people visited Splash Mountain. The second most popular ride visited was the Haunted Mansion (8.5 million). Big Thunder Mountain and Matterhorn Bobsleds had around 4 million and 3 million people visiting respectively. The least amount of travellers visited the Jungle Cruise (2 million).
(Word Count = 198 / Band Score 9)
Task Achievement – The answer provides relevant information, giving a clear overview and then describing the specific features in the main body paragraphs. The information is relevant to the question.
Coherence and Cohesion – The answer has been divided into clear logical paragraphs, with clear cohesion between them with the addition of linking words (overall, initially, furthermore).
Lexical Resource – There is evidence of paraphrasing, synonyms and some less common words.
Grammatical Range and Accuracy – The answer has no grammatical errors. The sentences are mainly made up of multiple clauses and have a variety of structures. There are no spelling mistakes and punctuation is correct.
TIP >> Remember to compare the information given, but focus on one idea in each main body paragraph.
TIP >> Remember to include numbers / stats / data in the main body paragraphs. This may seem obvious but many students do not include this.
Writing Task 1 Band Score 9 Criteria >>
We hope you found this post useful in helping you to study for the IELTS Test. If you have any questions please let us know in the comments below or on the Facebook page.
The best way to keep up to date with posts like this is to like us on Facebook, then follow us on Instagram and Pinterest.
If you need help preparing for the IELTS Test, join the IELTS Achieve Academy and see how we can assist you to achieve your desired band score. We offer an essay correction service, mock exams and online courses.