Essential strategies and practice techniques for this IELTS Reading question type. Learn how to manage time and improve accuracy.
Originally published March 2025. Last reviewed 3 July 2026.
The Blog post contains the following IELTS Reading Questions:
IELTS Reading Sentence Completion
IELTS Reading Diagram Labelling
IELTS Reading Multiple Choice Questions
Stay informed and prepared for success – Explore our comprehensive Reading Test Info page to get valuable insights, exam format details, and expert tips for mastering the IELTS Reading section.
IELTS Reading PassageIn Praise or Fast Food
In Praise or Fast Food
The media and a multitude of cookbook writers would have us believe that modern, fast, processed food is a disaster and that it is a mark of sophistication to bemoan the steel roller mill and sliced white bread while yearning for stone-ground flour and a brick oven. Perhaps, we should call those who scorn industrialized food, culinary Luddites, after the 19th-century English workers who rebelled against the machines that destroyed their way of life. Instead of technology, what these Luddites abhor is commercial sauces and any synthetic aid to flavoring our food. Culinary Luddism has come to signify more than just taste, however. It presents itself as a moral and political crusade, and it is here that I begin to back off. As a historian, I cannot accept the notion that the sunny, rural days of yesterday are in such contrast to the grey industrial present. I refute the philosophy that so crudely pits fresh and natural against processed and preserved, local against global, slow against fast, and additive-free against contaminated. History shows, I believe, that the Luddites have things back to front. It will come as a shock to many to discover that the notion of food being fresh and natural is a rather modern one. For our ancestors, what was natural frequently tasted bad. Fresh meat was rank and tough, fresh fruit inedibly sour, and fresh vegetables bitter. Natural was unreliable. Fresh milk soured, eggs went rotten, and everywhere seasons of plenty were followed by seasons of hunger. What’s more, natural was usually indigestible. Grains, which supplied 50 to 90 percent of the calories in most societies, had to be threshed, ground, and cooked to be fit for consumption. So to make food tasty, safe, digestible, and healthy, our forebears bred, ground, soaked, leached, curdled, fermented, and cooked naturally occurring plants and animals until they were nothing at all like their original form. They created sweet oranges and juicy apples and non-bitter legumes, happily abandoning their more natural but less tasty ancestors. They dried their meat and fruit, salted and smoked their fish, curdled and fermented their dairy products, and cheerfully used additives and preservatives like sugar, salt, oil, and vinegar to make the food edible. Eating fresh, natural food was regarded with suspicion verging on horror; only the uncivilized, the poor, and the starving resorted to it. The ancient Greeks regarded the consumption of greens and root vegetables as a sign of bad times, and many succeeding civilizations believed the same. Happiness was not a verdant garden abounding in fresh fruits, but a securely locked storehouse jammed with preserved, processed foods. What about the idea that the best food is handmade in the country? That food comes from the country goes without saying. However, the idea that country people eat better than city dwellers is preposterous. Very few of our ancestors working the land were independent peasants baking their bread and salting down their pigs. Most were burdened with heavy taxes and rent, often paid directly by the food they produced. Many were ultimately serfs or slaves, who subsisted on what was leftover watery soup and gritty flatbread. The dishes we call ethnic and assume to be of peasant origin were invented for the urban, or at least urbane, aristocrats who collected the surplus. This is as true of the lasagna of northern Italy as it is of the chicken korma of Mughal Delhi, the moo shu pork of imperial China, and the pilafs
Choose NO MORE THAN THREE WORDS from Reading Passage 3 for each answer.
Write your answers in boxes 27-29 on your answer sheet.
27 ………………………………….. = mass, produced bread.
28 ………………………………….. = traditionally produced bread
29 ………………………………….. enhanced by synthetic products
Ready to tackle Diagram Label Completion tasks with confidence? Click here to access our comprehensive guide and learn how to accurately label parts or components of diagrams in the IELTS Reading section.
Questions 30-34
Complete the sentences.
Write NO MORE THAN TWO WORDS from the passage for each answer.
Write your answers in boxes 30-34 on your answer sheet.
30The writer does not believe that a ……………………. philosophy of food production is superior to an industrialized philosophy of food production. 31In the past, the majority of fresh, natural food ……………………. and could not be relied on. 32Most people’s intake consisted largely of.. ………………….., which required a great deal of preparation. 33The ……………………. of food was unrecognizable once it had gone through the various processes of making it edible. 34For the ancient Greeks, a ……………………. full of food was preferable to a garden full of fruit.
Enhance your sentence completion skills in the IELTS Reading section. Click here to access our comprehensive guide and learn effective strategies for filling in missing words or phrases in sentences.
Questions 35-40
Choose the correct letter A, B, C, or D.
Write your answers in boxes 35-40 on your answer sheet.
35What does the writer say about peasants?
They had a better diet than most people living in cities.
They were largely self-sufficient.
Much of what they produced went to a landowner.
They created imaginative soup and flatbread dishes.
36Lasagna is an example of a dish
Invented by peasants.
Created for wealthy city-dwellers.
That was only truly popular in northern Italy.
That tastes like dishes from several other countries.
37Which of the following is NOT an important factor mentioned in the eighth and ninth paragraphs?
The development of take-away food as an option
The arduous nature of food preparation before mass-production
The global benefits of industrialized food production
The range of advantages that industrialized food production had
38What is the important point the writer wishes to make in the tenth paragraph?
There are disadvantages to modem food production as well as advantages.
People need to have a balanced diet.
People everywhere now have a huge range of food to choose from.
Demand for food that is traditionally produced exploits the people that produce it.
39The writer mentions chocolate, pasta, and canned tomatoes in the same paragraph because
The industrialized version has advantages over the natural version.
They are all products associated with a sophisticated lifestyle.
They are all products that have suffered from over-commercialization.
They are the most popular examples of industrial foods.
40What is the overall point that the writer makes in the reading passage?
People should learn the history of the food they consume.
Modem industrial food is generally superior to raw and natural food.
Criticism of industrial food production is largely misplaced.
People should be more grateful for the range of foods they can now choose from.
Ready to improve your performance in Multiple Choice Questions (MCQs)? Click here to access our comprehensive guide on how to tackle MCQs effectively in the IELTS Reading section.
27Answer: steel roller mill 28Answer: brick oven 29Answer: flavoring 30Answer: rural 31Answer: tasted bad 32Answer: grains 33Answer: original form 34Answer: storehouse 35Answer: C 36Answer: B 37Answer: A 38Answer: D 39Answer: A 40Answer: C
We hope you found this post useful in helping you to study for the IELTS Test. If you have any questions please let us know in the comments below or on the Facebook page.
The best way to keep up to date with posts like this is to like us on Facebook, then follow us on Instagram and Pinterest. If you need help preparing for the IELTS Test, join the IELTS Achieve Academy and see how we can assist you to achieve your desired band score. We offer an essay correction service, mock exams and online courses.
IELTS Writing Task 1 Academic multiple chart essay examples that is a band score 8. The question is: The pie chart below shows the main reasons why agricultural land becomes less productive. The table shows how these causes affected three regions of the world during the 1990s. Take a look at the sample answer.
IELTS Writing Task 1 Academic multiple chart essay example that is a band score 8. The question is: The pie charts show the main reasons for migration to and from the UK in 2007. Take a look at the sample answer.
IELTS Writing Task 1 Academic multiple chart essay example that is a band score 8. The question is: The charts below show reasons for travel and the main issues for the travelling public in the US in 2009. Take a look at the sample answer.
IELTS Writing Task 1 Academic multiple chart essay example that is a band score 8. The question is: The pie charts show the electricity generated in Germany and France from all sources and renewables in the year 2009. Take a look at the sample answer
IELTS Writing Task 1 Academic multiple chart essay example that is a band score 8. The question is: The line graph shows visits to and from the UK from 1979 to 1999, and the bar graph shows the most popular countries visited by UK residents in 1999. Take a look at the sample answer
When presented with two or more charts, graphs, or diagrams in IELTS Writing Task 1, you need to compare and contrast the data effectively while maintaining a clear, logical structure.
Strategy for Multiple Charts
Identify the connection: The charts are always related — find the common thread (same topic, different aspects).
Write a combined overview: Summarise the most significant trends from ALL charts in one overview paragraph.
Organise by chart or by theme: Either describe one chart per body paragraph, or group data thematically across charts.
Make comparisons: Actively compare data between charts using comparative language.
Useful Comparison Phrases
“While the bar chart shows…, the pie chart reveals…”
“In contrast to the data in Figure 1, Figure 2 indicates…”
“Both charts suggest that…”
“The table supports the trend shown in the graph, namely that…”
Originally published on IELTS Achieve. Last reviewed 3 July 2026.
Step-by-step guide to answering this type of IELTS Writing Task 1 question. Covers structure, key language, and band-scoring criteria.
Originally published May 2018. Last reviewed 3 July 2026.
In this post, we will look at a Writing Task 1 Academic multiple chart essay example from the IELTS writing task 1 Academic Test: Worldwide land degradation.
Students often ask if the questions are repeated year after year and the answer is no, but the type of chart or graph can be. There are so many questions written each year, you may find you practice answering various questions on different topics. It is best practice to learn how to answer each one of the various types of writing task 1 questions, from bar charts, line graphs, maps, process etc.
Take a look at the IELTS Writing Task 1 Multiple Charts and Graphs Academic essay example below:
*This multiple chart question and answer were provided by a student. IELTS Achieve did not design this question*
The Question is:
Worldwide land degradation
The pie chart below shows the main reasons why agricultural land becomes less productive. The table shows how these causes affected three regions of the world during the 1990s. Summarise the information by selecting and reporting main features, and make comparisons where relevant.
Causes of land degradation by region
Region
% land degraded by …
Deforestation
Over – cultivation
over – graing
total land degraded
North America
0.2
3.3
1.5
5%
Europe
9.8
7.7
5.5
23%
Ocenia*
1.7
0
11.3
13%
* A large group of islands in the South Pacific including Australia and New Zealand.
Take a look at the model answer.
The first diagram describes the comparative statistics of the 4 primary causes in the world of land deterioration, while the second chart illustrates the effects of this in three main continents mainly Oceania, North America and Europe in the year 1990. Overall, when it comes to reasons for land degradation, overgrazing garnered the highest percentage while the other category received the lowest fraction. Europe obtained the largest proportion of degraded land and North America had the lowest percentage obtained. On the one hand, overgrazing of farm animals established the primary reason for land deprivation with 35% followed by deforestation and over-cultivation with 30% and 28% respectively. With 7 % of the other reasons, the category had the smallest proportion. On the other hand, the European countries had the greatest proportion of degraded land with 23% with over-cultivation being the main reason trailed by Oceania and North America with 13% and 5% accordingly.
Word count – 150 / Band score 8
Instructor Feedback on Multiple Charts and Graphs Essay Modal Answer: Worldwide land degradation
Task Achievement – The answer provides a paraphrased question, to begin with, followed by an overview that gives the reader key information.
Coherence and Cohesion – The answer has been divided into clear logical paragraphs.
Lexical Resource – There is evidence of paraphrasing, synonyms and some less common words.
Grammatical Range and Accuracy – The answer has no grammatical errors. The sentences are mainly made up of multiple clauses and have a variety of structures.
We hope you found this post helpful in helping you to study for the IELTS Test. Let us know in the comments or on the Facebook page if you have any questions. The best way to keep up to date with posts like this is to like us on Facebook, and then follow us onInstagramand Pinterest. We offer essay correction services, mock exams, and online courses. If you need help preparing for the IELTS Test, join the IELTS Achieve Academy and see how we can help you achieve your desired band score faster.
Step-by-step guide to answering this type of IELTS Writing Task 1 question. Covers structure, key language, and band-scoring criteria.
Originally published May 2018. Last reviewed 3 July 2026.
In this post, we will look at a Writing Task 1 Academic multiple chart essay example from the IELTS writing task 1 Academic Test: Main reasons for migration.
Students often ask if the questions are repeated year after year and the answer is no, but the type of chart or graph can be. There are so many questions written each year, you may find you practice answering various questions on different topics. It is best practice to learn how to answer each one of the various types of writing task 1 questions, from bar charts, line graphs, maps, process etc.
Take a look at the IELTS Writing Task 1 Multiple Charts and Graphs Academic essay example below:
*This multiple chart question and answer were provided by a student. IELTS Achieve did not design this question*
The Question is:
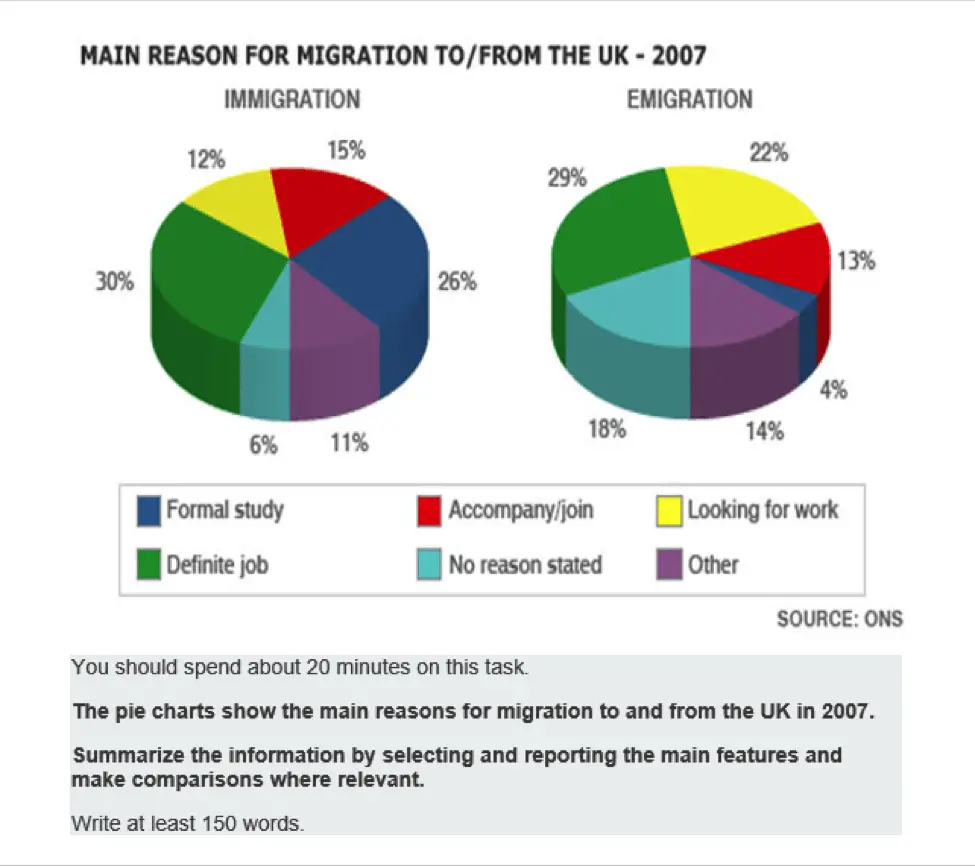
The main reason for migration
The pie charts show the main reasons for migration to and from the UK in 2007. Summarize the information by selecting and reporting the main features and make comparisons where relevant.
Write at least 150 words.
Take a look at the model answer.
The two charts illustrate the comparative statistics on the number of principal causes of travelling in and out from the UK in 2007. The units are measured in percentages and the source came from ONS. Overall, looking for work is the main purpose of migrating and emigrating to the UK while no reason stated had the lowest percentage of arrivals in the UK during 2007. It also can be seen that with regards to emigration, formal studies garnered the lowest fraction. On the one hand, the data shows that landing a worthy profession was consistently high in reasons for both going in and out of the country, 30% and 29% respectively. According to the data, there is a big difference in the percentage of formal studies in the UK, which gained 26% whereas only 4% were recorded of the number of people who studied outside of the UK in 2007. On the other hand, there is a slight difference between migrating (15%) and emigrating (13%) if the reason was to escort someone. The same can be seen in other purposes where 11% left for migration and 14% decided to emigrate respectively. However, the percentage doubled when looking for a job for both going in and out of the UK 12% and 22% correspondingly.
Word count – 213 / Band score 8
Instructor Feedback on Multiple Charts and Graphs Essay Modal Answer: Main reasons for migration
Task Achievement – The answer provides a paraphrased question, to begin with, followed by an overview that gives the reader key information.
Coherence and Cohesion – The answer has been divided into clear logical paragraphs.
Lexical Resource – There is evidence of paraphrasing, synonyms and some less common words.
Grammatical Range and Accuracy – The answer has no grammatical errors. The sentences are mainly made up of multiple clauses and have a variety of structures.
We hope you found this post helpful in helping you to study for the IELTS Test. Let us know in the comments or on the Facebook page if you have any questions. The best way to keep up to date with posts like this is to like us on Facebook, and then follow us onInstagramand Pinterest. We offer essay correction services, mock exams, and online courses. If you need help preparing for the IELTS Test, join the IELTS Achieve Academy and see how we can help you achieve your desired band score faster.
Step-by-step guide to answering this type of IELTS Writing Task 1 question. Covers structure, key language, and band-scoring criteria.
Originally published May 2018. Last reviewed 3 July 2026.
In this post, we will look at a Writing Task 1 Academic multiple chart essay example from the IELTS writing task 1 Academic Test. Students often ask if the questions are repeated year after year and the answer is no, but the type of chart or graph can be.
There are so many questions written each year, you may find you practice answering various questions on different topics. It is best practice to learn how to answer each one of the various types of writing task 1 questions, from bar charts, line graphs, maps, process etc.
If you would like to learn how to structure a multiple charts essay please click the button below >
Take a look at the IELTS Writing Task 1 Academic essay example below >>
*This multiple chart question and answer were provided by a student. IELTS Achieve did not design this question*
The bar chart gives information about the 5 main intentions of commuting in public in the US in 2009 while the pie chart illustrates the data with regards to the main concerns of Americans in using public transportation.
Overall, the main reason that Americans use public transport is to travel to their workplace and back home again whereas, they also highlighted that there are 6 problems that are usually encountered when travelling in public. The high cost of the fare topped their list while the area allotted to pedestrians was of the least concern.
On the one hand, there are five main purposes why Americans travelled in public in 2009. The main reason was travelling to and from work (49%) followed by personal reasons and shopping with 19% and 16% respectively. The data also shows that they used public transport for recreational purposes (10%) and lastly when they visited friends or relatives (6%).
On the other hand, the cost of travelling is their main issue in using public transportation garnering 36% while concerns about their safety came second with 19%. The data also illustrates concerns about aggressive drivers and traffic problems with 17% and 14% respectively. Accessibility to public vehicles and space for pedestrians were also mentioned with 8% and 6% correspondingly.
Word count – 212 / Band score – 8
Task Achievement – The answer provides a paraphrased question, to begin with, followed by an overview that gives the reader key information.
Coherence and Cohesion – The answer has been divided into clear logical paragraphs.
Lexical Resource – There is evidence of paraphrasing, synonyms and some less common words.
Grammatical Range and Accuracy – The answer has no grammatical errors. The sentences are mainly made up of multiple clauses and have a variety of structures.
We hope you found this post helpful in helping you to study for the IELTS Test. Let us know in the comments or on the Facebook page if you have any questions. The best way to keep up to date with posts like this is to like us on Facebook, and then follow us onInstagramand Pinterest. We offer essay correction services, mock exams, and online courses. If you need help preparing for the IELTS Test, join the IELTS Achieve Academy and see how we can help you achieve your desired band score faster.
Step-by-step guide to answering this type of IELTS Writing Task 1 question. Covers structure, key language, and band-scoring criteria.
Originally published May 2018. Last reviewed 3 July 2026.
In this post, we will look at a Writing Task 1 Academic Multiple Charts and Graphs Essay Answer example.
Students often ask if the questions are repeated year after year and the answer is no, but the type of chart or graph can be. There are so many questions written each year, you may find, you practice answering various questions on different topics. It is best practice to learn how to answer each one of the various types of writing task 1 questions, from bar charts, line graphs, maps, process etc.
If you would like to learn how to structure a multiple charts essay please click the button below:
Take a look at the IELTS Writing Task 1 Multiple Charts and Graphs Academic essay example below:
*This multiple chart question and answer were provided by a student. IELTS Achieve did not design this question*
You should spend about 20 minutes on this task.
Electricity Sources:
The Pie Charts show the electricity generated in Germany and France from all sources and renewables in the year 2009. Summarize the information by selecting and reporting the main features and make comparisons where relevant.
Write at least 150 words.
Take a look at the model answer.
The first charts give information on how electricity is generated from two countries (Germany and France) in 2009 while the diagrams opposite illustrate the different sources of renewable energies from France and Germany. The units of measurements are in kWh. Overall, conventional thermal energy is the primary source of electrical power in Germany whereas French people depended on nuclear resources for their main electrical energy. The data also displays in regards to renewable energy, that Germany relied on biomass and wind power while France considered hydroelectricity to be their main source of renewable power. On the one hand, garnering a 59.6% fraction of the pie chart, Germany trusted conventional thermal energy to be the main source of their electricity followed by nuclear and renewable with both 23% and 17.4% respectively, whereas French citizens were very confident to use the nuclear power plant as the main foundation of their electrical supply with 76% followed by renewables (13.7%) and conventional thermal (10.3%). On the other hand, the primary source of renewable energy in Germany was the use of biomass 39.3% and this was closely followed by wind power generation (36.9%). Hydroelectric sources came in with 17.7% then via solar power with only 6.1%. The data also shows that France is confident with hydroelectric power to provide electricity with 80.3% whereas only 10.5% and 8.1% electrical power have been provided by wind and biomass respectively. Similarly, solar energy came second to the last with only .9% while both countries didn’t want to rely on geothermal sources.
Word count – 253 / Band score – 8
*This is a high word count for writing task 1 – it could be edited in places.*
Instructor Feedback on Multiple Charts and Graphs Essay Modal Answer: Electricity Sources
Task Achievement – The answer provides a paraphrased question, to begin with, followed by an overview that gives the reader key information.
Coherence and Cohesion – The answer has been divided into clear logical paragraphs.
Lexical Resource – There is evidence of paraphrasing, synonyms and some less common words.
Grammatical Range and Accuracy – The answer has no grammatical errors. The sentences are mainly made up of multiple clauses and have a variety of structures.
We hope you found this post helpful in helping you to study for the IELTS Test. Let us know in the comments or on the Facebook page if you have any questions. The best way to keep up to date with posts like this is to like us on Facebook, and then follow us onInstagramand Pinterest. We offer essay correction services, mock exams, and online courses. If you need help preparing for the IELTS Test, join the IELTS Achieve Academy and see how we can help you achieve your desired band score faster.