Step-by-step guide to answering this type of IELTS Writing Task 1 question. Covers structure, key language, and band-scoring criteria.
Originally published May 2018. Last reviewed 3 July 2026.
In this post, we will look at a Writing Task 1 Academic multiple chart essay example from the IELTS writing task 1 Academic Test: Main reasons for migration.
Students often ask if the questions are repeated year after year and the answer is no, but the type of chart or graph can be. There are so many questions written each year, you may find you practice answering various questions on different topics. It is best practice to learn how to answer each one of the various types of writing task 1 questions, from bar charts, line graphs, maps, process etc.
Take a look at the IELTS Writing Task 1 Multiple Charts and Graphs Academic essay example below:
*This multiple chart question and answer were provided by a student. IELTS Achieve did not design this question*
The Question is:
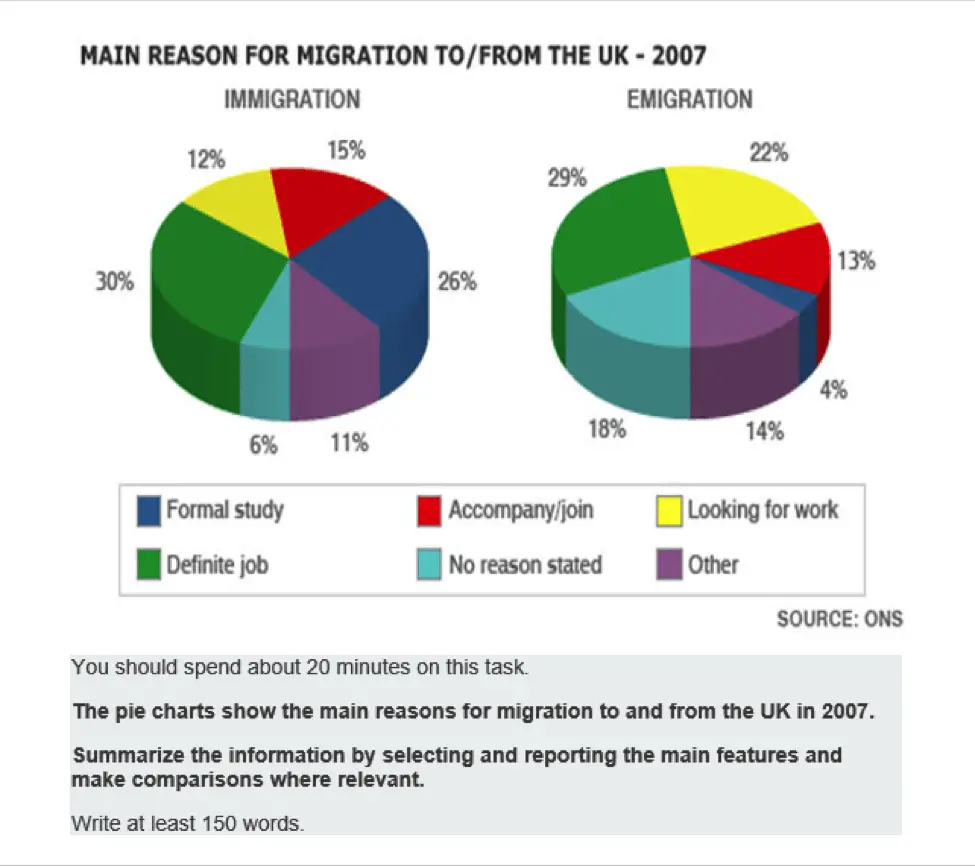
The main reason for migration
The pie charts show the main reasons for migration to and from the UK in 2007. Summarize the information by selecting and reporting the main features and make comparisons where relevant.
Write at least 150 words.
Take a look at the model answer.
The two charts illustrate the comparative statistics on the number of principal causes of travelling in and out from the UK in 2007. The units are measured in percentages and the source came from ONS. Overall, looking for work is the main purpose of migrating and emigrating to the UK while no reason stated had the lowest percentage of arrivals in the UK during 2007. It also can be seen that with regards to emigration, formal studies garnered the lowest fraction. On the one hand, the data shows that landing a worthy profession was consistently high in reasons for both going in and out of the country, 30% and 29% respectively. According to the data, there is a big difference in the percentage of formal studies in the UK, which gained 26% whereas only 4% were recorded of the number of people who studied outside of the UK in 2007. On the other hand, there is a slight difference between migrating (15%) and emigrating (13%) if the reason was to escort someone. The same can be seen in other purposes where 11% left for migration and 14% decided to emigrate respectively. However, the percentage doubled when looking for a job for both going in and out of the UK 12% and 22% correspondingly.
Word count – 213 / Band score 8
Instructor Feedback on Multiple Charts and Graphs Essay Modal Answer: Main reasons for migration
Task Achievement – The answer provides a paraphrased question, to begin with, followed by an overview that gives the reader key information.
Coherence and Cohesion – The answer has been divided into clear logical paragraphs.
Lexical Resource – There is evidence of paraphrasing, synonyms and some less common words.
Grammatical Range and Accuracy – The answer has no grammatical errors. The sentences are mainly made up of multiple clauses and have a variety of structures.
We hope you found this post helpful in helping you to study for the IELTS Test. Let us know in the comments or on the Facebook page if you have any questions. The best way to keep up to date with posts like this is to like us on Facebook, and then follow us onInstagramand Pinterest. We offer essay correction services, mock exams, and online courses. If you need help preparing for the IELTS Test, join the IELTS Achieve Academy and see how we can help you achieve your desired band score faster.
Step-by-step guide to answering this type of IELTS Writing Task 1 question. Covers structure, key language, and band-scoring criteria.
Originally published May 2018. Last reviewed 3 July 2026.
In this post, we will look at a Writing Task 1 Academic multiple chart essay example from the IELTS writing task 1 Academic Test. Students often ask if the questions are repeated year after year and the answer is no, but the type of chart or graph can be.
There are so many questions written each year, you may find you practice answering various questions on different topics. It is best practice to learn how to answer each one of the various types of writing task 1 questions, from bar charts, line graphs, maps, process etc.
If you would like to learn how to structure a multiple charts essay please click the button below >
Take a look at the IELTS Writing Task 1 Academic essay example below >>
*This multiple chart question and answer were provided by a student. IELTS Achieve did not design this question*
The bar chart gives information about the 5 main intentions of commuting in public in the US in 2009 while the pie chart illustrates the data with regards to the main concerns of Americans in using public transportation.
Overall, the main reason that Americans use public transport is to travel to their workplace and back home again whereas, they also highlighted that there are 6 problems that are usually encountered when travelling in public. The high cost of the fare topped their list while the area allotted to pedestrians was of the least concern.
On the one hand, there are five main purposes why Americans travelled in public in 2009. The main reason was travelling to and from work (49%) followed by personal reasons and shopping with 19% and 16% respectively. The data also shows that they used public transport for recreational purposes (10%) and lastly when they visited friends or relatives (6%).
On the other hand, the cost of travelling is their main issue in using public transportation garnering 36% while concerns about their safety came second with 19%. The data also illustrates concerns about aggressive drivers and traffic problems with 17% and 14% respectively. Accessibility to public vehicles and space for pedestrians were also mentioned with 8% and 6% correspondingly.
Word count – 212 / Band score – 8
Task Achievement – The answer provides a paraphrased question, to begin with, followed by an overview that gives the reader key information.
Coherence and Cohesion – The answer has been divided into clear logical paragraphs.
Lexical Resource – There is evidence of paraphrasing, synonyms and some less common words.
Grammatical Range and Accuracy – The answer has no grammatical errors. The sentences are mainly made up of multiple clauses and have a variety of structures.
We hope you found this post helpful in helping you to study for the IELTS Test. Let us know in the comments or on the Facebook page if you have any questions. The best way to keep up to date with posts like this is to like us on Facebook, and then follow us onInstagramand Pinterest. We offer essay correction services, mock exams, and online courses. If you need help preparing for the IELTS Test, join the IELTS Achieve Academy and see how we can help you achieve your desired band score faster.
Step-by-step guide to answering this type of IELTS Writing Task 1 question. Covers structure, key language, and band-scoring criteria.
Originally published May 2018. Last reviewed 3 July 2026.
In this post, we will look at a Writing Task 1 Academic Multiple Charts and Graphs Essay Answer example.
Students often ask if the questions are repeated year after year and the answer is no, but the type of chart or graph can be. There are so many questions written each year, you may find, you practice answering various questions on different topics. It is best practice to learn how to answer each one of the various types of writing task 1 questions, from bar charts, line graphs, maps, process etc.
If you would like to learn how to structure a multiple charts essay please click the button below:
Take a look at the IELTS Writing Task 1 Multiple Charts and Graphs Academic essay example below:
*This multiple chart question and answer were provided by a student. IELTS Achieve did not design this question*
You should spend about 20 minutes on this task.
Electricity Sources:
The Pie Charts show the electricity generated in Germany and France from all sources and renewables in the year 2009. Summarize the information by selecting and reporting the main features and make comparisons where relevant.
Write at least 150 words.
Take a look at the model answer.
The first charts give information on how electricity is generated from two countries (Germany and France) in 2009 while the diagrams opposite illustrate the different sources of renewable energies from France and Germany. The units of measurements are in kWh. Overall, conventional thermal energy is the primary source of electrical power in Germany whereas French people depended on nuclear resources for their main electrical energy. The data also displays in regards to renewable energy, that Germany relied on biomass and wind power while France considered hydroelectricity to be their main source of renewable power. On the one hand, garnering a 59.6% fraction of the pie chart, Germany trusted conventional thermal energy to be the main source of their electricity followed by nuclear and renewable with both 23% and 17.4% respectively, whereas French citizens were very confident to use the nuclear power plant as the main foundation of their electrical supply with 76% followed by renewables (13.7%) and conventional thermal (10.3%). On the other hand, the primary source of renewable energy in Germany was the use of biomass 39.3% and this was closely followed by wind power generation (36.9%). Hydroelectric sources came in with 17.7% then via solar power with only 6.1%. The data also shows that France is confident with hydroelectric power to provide electricity with 80.3% whereas only 10.5% and 8.1% electrical power have been provided by wind and biomass respectively. Similarly, solar energy came second to the last with only .9% while both countries didn’t want to rely on geothermal sources.
Word count – 253 / Band score – 8
*This is a high word count for writing task 1 – it could be edited in places.*
Instructor Feedback on Multiple Charts and Graphs Essay Modal Answer: Electricity Sources
Task Achievement – The answer provides a paraphrased question, to begin with, followed by an overview that gives the reader key information.
Coherence and Cohesion – The answer has been divided into clear logical paragraphs.
Lexical Resource – There is evidence of paraphrasing, synonyms and some less common words.
Grammatical Range and Accuracy – The answer has no grammatical errors. The sentences are mainly made up of multiple clauses and have a variety of structures.
We hope you found this post helpful in helping you to study for the IELTS Test. Let us know in the comments or on the Facebook page if you have any questions. The best way to keep up to date with posts like this is to like us on Facebook, and then follow us onInstagramand Pinterest. We offer essay correction services, mock exams, and online courses. If you need help preparing for the IELTS Test, join the IELTS Achieve Academy and see how we can help you achieve your desired band score faster.
Step-by-step guide to answering this type of IELTS Writing Task 1 question. Covers structure, key language, and band-scoring criteria.
Originally published May 2018. Last reviewed 3 July 2026.
In this post, we will look at a Writing Task 1 Academic multiple chart essay example Visits to and from the UK from the IELTS writing task 1 Academic Test.
Students often ask if the questions are repeated year after year and the answer is no, but the type of chart or graph can be. There are so many questions written each year, you may find you practice answering various questions on different topics. It is best practice to learn how to answer each one of the various types of writing task 1 questions, from bar charts, line graphs, maps, process etc.
If you would like to learn how to structure a multiple charts essay please click the button below:
Take a look at the IELTS Multiple Charts Essay example below:
*This multiple chart question and answer were provided by a student. IELTS Achieve did not design this question*
Visits to and from the UK
You should spend about 20 minutes on this task. The line graph shows visits to and from the UK from 1979 to 1999, and the bar graph shows the most popular countries visited by UK residents in 1999. Summarize the information by selecting and reporting the main features and make comparisons where relevant. Write at least 150 words.
Take a look at the model answer.
The line graph illustrates the comparative statistics on the number of people who visited the UK and the number of British citizens who went outside the country during a 20-year period whereas the bar chart gives detail about the top 5 well-liked countries visited by the British people. The units of measurement are in millions.
Overall, the number of people who visited the UK increased gradually over the years. Similarly, the same trend can be seen in the British people who went out of the country for a vacation. The data also gives information about France, which received the highest number of visiting Brits in the span of 20 years, whereas Turkey had the least number of visitors.
On the one hand, around 10 million visitors who went to the UK were recorded in 1979, it then reached a plateau in 1984 and gradually increased by almost double when it reached 1989. The trend kept on increasing in 1994 up until 1999 when it received 25 million guests and almost 30 million visitors respectively. The same can be concluded of the British people who travelled abroad, almost 11 million UK citizens left the country in 1979 and then it progressively increased up until 1999 where it reached its all-time high of nearly 54 million vacationers.
On the other hand, France ranked first among the five countries that are listed in the data wherein it garnered almost 11 million visitors in 1999. Spain and the USA followed with nearly 9 million visitors and almost 4 million guests respectively. The data also shows that Greece received close to 3.5 million visitors whereas only 3 million British citizens visited Turkey.
Word count – 277 / Band score 8
Instructor Feedback on IELTS Multiple Charts Essay: Visits to and from the UK
Task Achievement – The answer provides a paraphrased question, to begin with, followed by an overview that gives the reader key information.
Coherence and Cohesion – The answer has been divided into clear logical paragraphs.
Lexical Resource – There is evidence of paraphrasing, synonyms and some less common words.
Grammatical Range and Accuracy – The answer has no grammatical errors. The sentences are mainly made up of multiple clauses and have a variety of structures.
We hope you found this post helpful in helping you to study for the IELTS Test. Let us know in the comments or on the Facebook page if you have any questions. The best way to keep up to date with posts like this is to like us on Facebook, and then follow us onInstagramand Pinterest. We offer essay correction services, mock exams, and online courses. If you need help preparing for the IELTS Test, join the IELTS Achieve Academy and see how we can help you achieve your desired band score faster.
A detailed guide to this IELTS Writing Task 2 essay type, with structure templates, useful vocabulary, and techniques to achieve Band 7+.
Originally published April 2018. Last reviewed 3 July 2026.
In this post, we will look at a discussion essay example from the IELTS writing task 2 test. Students often ask if the questions are repeated year after year and the answer is no, but the topics are. There are so many questions written each year, you may find your practice answering various questions on different topics. For example, you could write essays to answer questions about education or the environment, which benefits you because you learn vocabulary associated with those topics and develop ideas that can help you in your writing test.
Practising writing IELTS task 2 essays on a range of topics is a great way to learn new vocabulary for those topics, but also to practice your essay structures. You begin to develop your ideas around those topics, thinking of examples and giving your opinions.
If you would like to purchase a 34 page PDF download that is easy to read and print out please take a look at the bookshop >
If you would like to learn how to structure a discussion essay please click the button below >
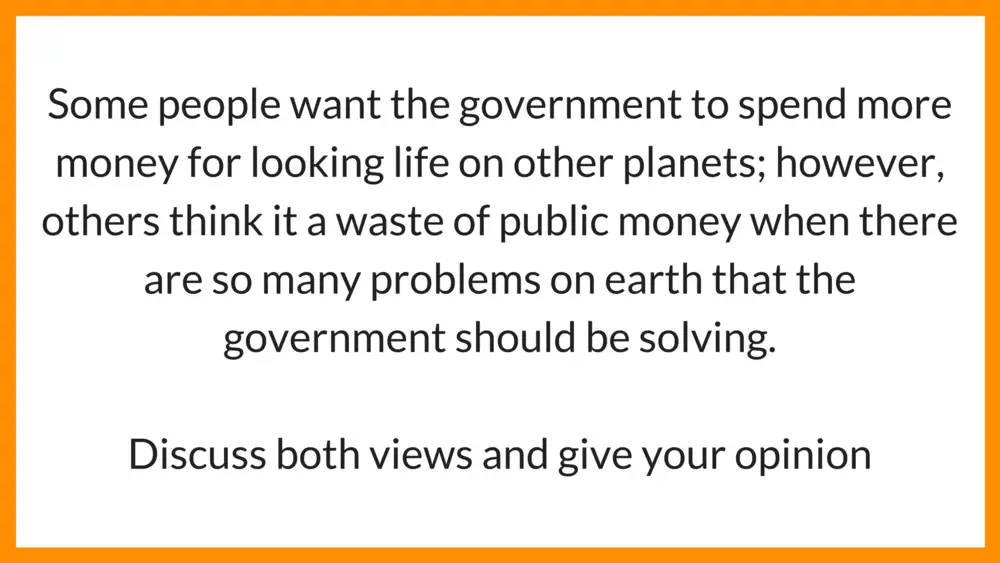
There are numbers of men and women who insist for the administration to allocate funds for space exploration while some believe that there are more important projects that need to be addressed. Firstly this essay will discuss the reasons for space voyaging and secondly, the detrimental effects of allocating funds for this exploration.
On the one hand, space is a mysterious place, that requires large amounts of money to explore. The government and many people all over the world think that there are other kinds of species that dwell in the far galaxy. They believe that providing funds for space exploration is needed and vital in developing the future of our own planet. For instance, a report from NASA in 2016 revealed that there is a government funded scheme that allocates more than 30% of taxpayers money to further space exploration programmes.
On the other hand, building a spacecraft that can travel through space needs millions of dollars. This can dissolve the budget set aside for more important projects that could help the world to improve its condition. The time that they spend on space exploration is no joke, as many astronauts often stay 10 years or more to study the galaxy and since that’s unfamiliar territory the chances of experiencing malfunctions or encountering danger are far greater. For example, an article by the Space Explorer in 2016 revealed that only 3 out of 10 of Russia’s space explorations missions are successful.
In my opinion, I believe that although it is interesting to know if there are other forms of life living on the other planets, we should give our time and invest our money into more important problems that our world is experiencing now. Problems like famine, climate change and population explosion are the ones that we need to address in order to heal the earth. For instance, a study by the World Wildlife Fund in 2017 discovered that by the year 2030 more and more species of animals will be extinct if people do not change their lifestyle and habits.
In conclusion, space exploration can wait. We should first take care and heal the only planet that we are living in for this is the only place that we are sure can sustain our race.
(Word count – 377 / Band score 8)
Task Achievement – The essay provides an answer to the question asked, supported by relevant examples.
Coherence and Cohesion – The answer has been divided into clear logical paragraphs and each main body paragraph only has one main idea. There are cohesive links between the main body paragraphs.
Lexical Resource – There is evidence of a wide range of vocabulary, with no errors in the text.
Grammatical Range and Accuracy – The answer has no grammatical errors. The sentences have a wide range of structures.
We hope you found this post useful in helping you to study for the IELTS Test. If you have any questions please let us know in the comments below or on the Facebook page.
The best way to keep up to date with posts like this is to like us on Facebook, then follow us on Instagram and Pinterest.
If you need help preparing for the IELTS Test, join the IELTS Achieve Academy and see how we can assist you to achieve your desired band score. We offer an essay correction service, mock exams and online courses.