

⚡ TL;DR
Step-by-step guide to answering this type of IELTS Writing Task 1 question. Covers structure, key language, and band-scoring criteria.
Originally published May 2017. Last reviewed 3 July 2026.

This post will help you to write a successful pie charts essay, there is a model answer for you to compare your work to at the end of the post.
Remember that your essay should have a minimum of 150 words and ideally should be completed in 20 minutes.
The writing task 1 essay structure should be as follows >>

Question
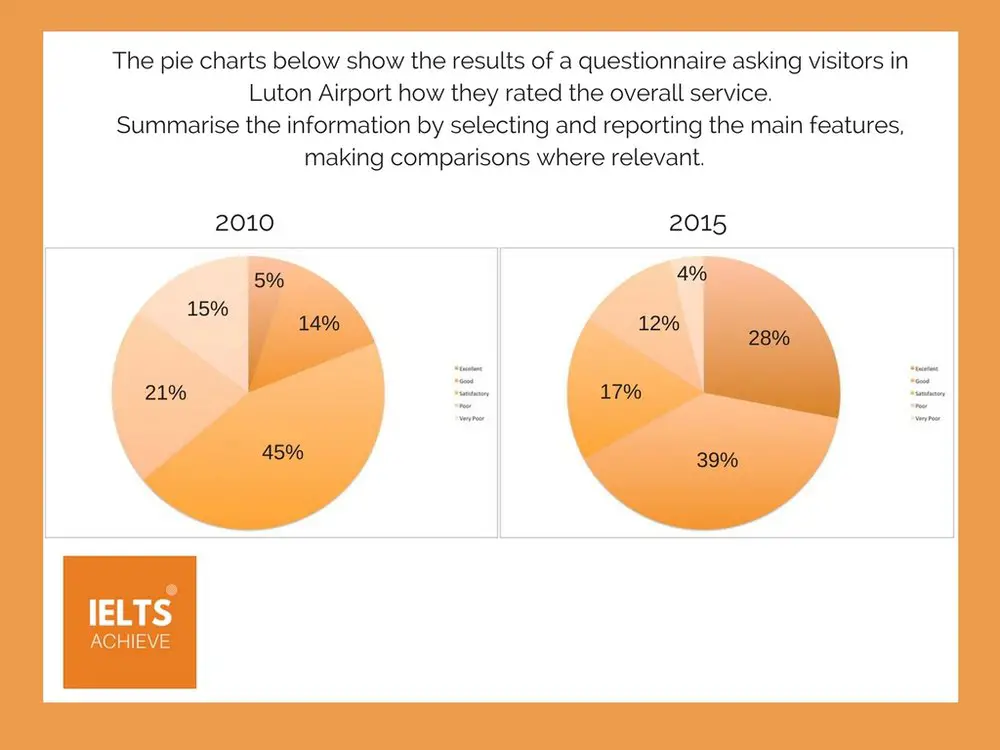
Read the question below carefully, what can you see in the information given?
Step 1 - Write the introduction
Write your own introduction of one or two sentences, paraphrasing the question, using synonyms where you can.
Step 2 - Write an overview
Write the overview - start this paragraph with the word 'Overall...' and write one or two sentences which describe the main features of the information presented in the charts.
Step 3 - Write the main body paragraphs
Write two main body paragraphs, going into detail and giving specific information about the charts. Remember to include data to support your findings. For example, look for the highs and lows and any major increases or decreases over time.
Step 4 - Check your work
When you have completed the essay, check it for any errors, spelling or grammar. Then check to see if you have included linking words that connect the information together, making it easy to read. For example, using the word 'Overall..' at the beginning of the overview paragraph. You can also use words like - on the one hand, on the other hand, furthermore, however, in addition, finally etc.
Model Answer
To view the model answer for this question please click the button below >>
We hope you found this post useful in helping you to study for the IELTS Test. If you have any questions please let us know in the comments below or on the Facebook page.
The best way to keep up to date with posts like this is to like us on Facebook, then follow us on Instagram and Pinterest.
If you need help preparing for the IELTS Test, join the IELTS Achieve Academy and see how we can assist you to achieve your desired band score. We offer an essay correction service, mock exams and online courses.
How to Describe Tables in IELTS Writing Task 1
Table questions present numerical data organised in rows and columns. Your task is to identify, compare, and summarise the key features without describing every single number.
Strategy for Table Questions
- Scan for patterns: Look for the highest and lowest values, trends over time, and significant differences between categories.
- Select key data: You cannot mention every number. Choose the most significant figures that illustrate trends or comparisons.
- Group information: Organise your body paragraphs by theme (e.g., countries that increased vs. decreased) rather than going row by row.
- Include specific figures: Support your observations with actual numbers from the table.
Useful Language for Tables
| Function | Phrases |
|---|---|
| Highest value | The highest figure was recorded for…, X had the largest proportion at… |
| Lowest value | The lowest rate was seen in…, X accounted for the smallest share… |
| Comparison | X was significantly higher than Y…, Compared with X, Y was… |
| Approximate data | roughly, approximately, just over, just under, around |
Common Mistakes
- Describing every number in the table instead of selecting key data
- Failing to make comparisons between categories
- Writing without an overview paragraph
- Using imprecise language when exact figures are available
Originally published on IELTS Achieve. Last reviewed 3 July 2026.